zPlanner is a replication planning tool that analyzes VMware virtual machine storage patterns and helps plan for replication to the public cloud (or other disaster recovery locations). If you want to learn more about what zPlanner is, then check out the first article I wrote about it here.
In the beginning
Finding a place to run the scripts
When building something that you need to be able to freely distribute, one tends to veer away from Microsoft Windows since it requires someone to buy a license. However, with VMware’s super limited options for getting stats from VMware… you are pretty much stuck with using PowerShell in some form.
Luckily Microsoft has been publishing a version of PowerShell for Linux for a while now, and while it’s not 100% compatible with VMware’s PowerCLI, it does work well enough that we can get some scripts to run.
[stextbox id=’info’]If you are interested in running PowerCLI on PowerShell for Linux you will notice that when loading the PowerShell module several of the submodules fail to load. However, the modules that do load are operational.[/stextbox]
So with PowerShell for Linux in my pocket, creating a free to use virtual appliance that can run PowerCLI scripts get’s a lot easier. I go into detail on what makes up zPlanner over on my intro blog post. I recommend reading that post before continuing on here.
The rest of this article will be the, in the weeds, details on scripting and how it all gets pulled together into zPlanner.
Getting the right data
When I started the zPlanner project I wasn’t looking to reinvent the wheel. After some Googling, I was able to find a great PowerShell module written by Markus Kraus over at mycloudrevolution.com that would help get me started. In his module, there is a function called Get-VMmaxIOPS, and out-of-the-box, it gathers almost everything I needed.
It’s also really easy to use:
[powershell]Get-VMmaxIOPS -VMs $SameVMs -Minutes 5[/powershell]
Super easy right? … Call the cmdlet, send it a list of virtual machines to get data for and how long should the data go back.
In return, you get an easy to read results table.

In the results table, you get stats for both read and write and the metrics are IOPS and Throughput. It’s also super cool because it gives you those results per SCSI device as well as the total per VM.
So now that I had a way to get the data, I needed a way to load the data into MySQL. I went looking for a PowerShell module that could connect to MySQL, but unfortunately, there were zero options for the Linux version of PowerShell. So I went back to the old programming language I know and love… PHP. Essentially I wrote a helper script that just takes a CSV file and inserts it into MySQL, which means that the PowerShell script just needed to dump its results to CSV, then call the PHP script to load the CSV to MySQL.
The code to make this app happen became the “vm-getio.ps1” script. To automate things a bit, I required a list of VMs to be monitored be placed into a CSV file. From there the vm-getio.ps1 script would read the list of VMs then fire up PowerCLI to get the data, then call the PHP script to insert the data to MySQL.
Abstract of the first vm-getio.ps1 script:
[powershell]# Get Config file paths
$Config = "/home/zerto/include/config.txt"
$csvPath = "/home/zerto/data/stats.csv"
$vmlist = "/home/zerto/data/vmlist.csv"
# Get Credentials from file and login to vCenter via PowerCLI
$env = get-content $Config | out-string | convertFrom-StringData
$env.password = $env.password | convertto-securestring -Key $Key
$mycreds = New-Object System.Management.Automation.PSCredential ($env.username, $env.password)
Import-Module -Name /home/zerto/zplanner/modules/get-vmmaxiops.psm1
$session = Connect-VIServer -Server $env.vcenter -Credential $mycreds
# Import VM list from CSV file
$list = Import-CSV $vmlist
# Get stats for each VM in list using mycloudrevolution.com module
ForEach ($vm in $list){
$report += Get-VM -Name $vm.Name | Get-VMmaxIOPS -Minutes $int
}
# Disconnect from vCenter
disconnect-viserver $session -confirm:$false
# Write stats to CSV
$report | select "VM", "Disk", "CapacityGB", "IOPSReadAvg", "IOPSWriteAvg", "KBWriteAvg", "KBReadAvg" | ConvertTo-Csv | Select -Skip 1 | Out-File $csvPath
# Call PHP helper script to load CSV to MySQL
/usr/bin/php /home/zerto/zplanner/loaders/loadmysql.php stats.csv
[/powershell]
When testing in my lab it took about 2-3 minutes to get stats for about 40 VMs. I didn’t think that was too bad, but when I scale tested it in Shannon Snowden‘s zerto lab, which has more than 600VMs things got pretty slow… it would take over 30 minutes to run the script on all 600VMs. Since I was shooting for a solution that could support a minimum of 1000 VMs I needed to do some rework for scale purposes.
Before I explain the rework for scalability, I want to talk about moving the code to GitHub, which is something you should do if you are planning to have push lots of updates for a project.
Fast Forward to zPlanner 3.0
Implementing my (bastardized) version of Continuous Integration
Let me start by saying that I do NOT consider myself a programmer. I consider myself the master of trial and error… and Google. So, when doing a project like zPlanner, there are LOTs of updates to the code that makes it work. I am always finding errors in my code, as well as better ways to do things. Getting those updates into a “shipping” product has to be efficient.
The first two version of zPlanner did not use GitHub, they were just OVA files with the latest code at the time of export. Both versions were available for about 24 hours each, I knew I had to do something different as I couldn’t roll a new OVA every 24 hours.
Enter GitHub.
To start I had to bring all of the code for zPlanner under a common folder, this would become the repository. Then I had to adjust all of the paths in scripts as well as create a way for people who don’t know GitHub to be able to update their appliance. The end result is awesomeness. I can push as many code changes per day that I want, and all you have to do is run the “Update zPlanner” menu item. Within 30 seconds your zPlanner has the latest scripts.
zPlanner v3 is the current ISO image, it probably won’t be the last, but until I need to make some major modifications updating from a GitHub repository has been working great!
The Puzzle Pieces – zPlanner folder tree
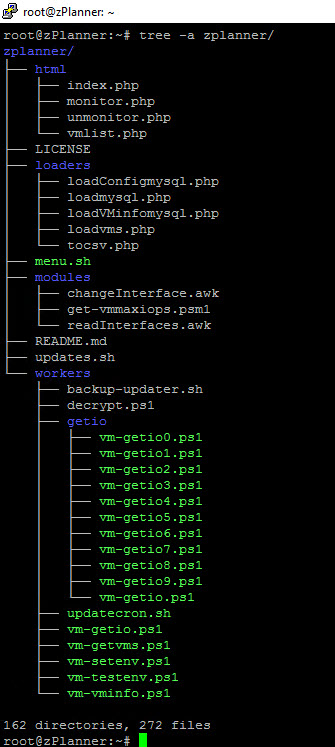
Before I deep dive into some of the components of zPlanner 3.0 let’s take a high-level view of what is in the GitHub Repository.

I tried to keep things pretty organized. There are four main folders as well as the dashboard menu and an update script.
HTML
This directory contains all of the web UI that is homegrown. The zPlanner OVA symlinks this folder to /var/www/html/ so that any updates from GitHub are instantly available in the web interface. The web interface is growing more important, I will explain the new way to create your list of monitored VMs as well as what the roadmap holds for vpg planning later in this post. Note, there are other web components such as Grafana and phpMyAdmin but I don’t develop them and they are part of the OS install just like PHP and PowerShell, and therefore outside of zPlanner’s repo.
Loaders
These scripts are mostly PHP scripts for working with the MySQL database. I called it loaders because in the beginning all of these scripts were for loading data into MySQL. In the later versions of zPlanner, there are also scripts to pull data out of MySQL as well.
Modules
The files in this folder are from 3rd party sources. I am using them as modules in my scripts so I don’t have to recreate the wheel. I have tried to keep these scripts as close to the author’s original copy but in some cases, I had to make some changes. All files still retain the original credits, so if you are working on something and want to go back to the original file, open them up and take a look for the author’s name and site.
Workers
This folder, and the sub-folder getio, contain all of the PowerShell scripts that get stats. We will spend a lot of time in the next section talking about the scripts in this folder.
Scaling zPlanner
So how do we turn this thing up to 11… or more specifically 1000 VMs? Well, I’d love to tell you that VMware released some super cool way to get a lot of stats really quickly. But they didn’t. Instead, the only way I found was to scale out the vm-getio.ps1 script. Have you ever heard of PowerShell Jobs? Me neither.
PowerShell Jobs
Think of PowerShell Jobs as the poor man’s multi-threading. Essentially it allows a single PowerShell script to start a whole bunch of stuff, and wait for each of those things to finish before moving on. So for zPlanner, I start ten different vm-getio.ps1 scripts and divide the VMs between them. Like I said… poor mans multi-threading.
If you recall, vm-getio.ps1 read a list of VMs from a CSV file and then fed them into the Get-VMmaxIOPS cmdlet. I moved that script to a group of scripts called vm-getio[1-10].ps1 and replaced vm-getio.ps1 with this:
[powershell]#!/usr/bin/pwsh
# start stopwatch for auto scheduling
$stopwatch = [system.diagnostics.stopwatch]::startNew();
#read how long the last stats run took to complete
$exectimefile = "/home/zerto/include/exectime.txt"
#make sure the script isnt already running by using a lockfile
$lockfile = "/home/zerto/data/getio.pid"
$lockstatus = 0
While ($lockstatus -ne 1)
{
If (Test-Path $lockfile)
{
echo “Lock file found!”
$pidlist = Get-content $lockfile
If (!$pidlist)
{
$PID | Out-File $lockfile
$lockstatus = 1
}
$currentproclist = Get-Process | ? { $_.id -match $pidlist }
If ($currentproclist)
{
# if the script is already running die
echo “lockfile in use by other process!”
exit
}
Else
{
Remove-Item $lockfile -Force
$PID | Out-File $lockfile
$lockstatus = 1
}
}
Else
{
$PID | Out-File $lockfile
$lockstatus = 1
}
}
# get latest monitored VMs and sort into csv files
/usr/bin/php /home/zerto/zplanner/loaders/tocsv.php
#start getio workers threads
start-job -Name GetIO0 -ScriptBlock {pwsh /home/zerto/zplanner/workers/getio/vm-getio0.ps1}
start-job -Name GetIO1 -ScriptBlock {pwsh /home/zerto/zplanner/workers/getio/vm-getio1.ps1}
start-job -Name GetIO2 -ScriptBlock {pwsh /home/zerto/zplanner/workers/getio/vm-getio2.ps1}
start-job -Name GetIO3 -ScriptBlock {pwsh /home/zerto/zplanner/workers/getio/vm-getio3.ps1}
start-job -Name GetIO4 -ScriptBlock {pwsh /home/zerto/zplanner/workers/getio/vm-getio4.ps1}
start-job -Name GetIO5 -ScriptBlock {pwsh /home/zerto/zplanner/workers/getio/vm-getio5.ps1}
start-job -Name GetIO6 -ScriptBlock {pwsh /home/zerto/zplanner/workers/getio/vm-getio6.ps1}
start-job -Name GetIO7 -ScriptBlock {pwsh /home/zerto/zplanner/workers/getio/vm-getio7.ps1}
start-job -Name GetIO8 -ScriptBlock {pwsh /home/zerto/zplanner/workers/getio/vm-getio8.ps1}
start-job -Name GetIO9 -ScriptBlock {pwsh /home/zerto/zplanner/workers/getio/vm-getio9.ps1}
# wait for all jobs to complete before exiting session
Get-Job | Wait-Job
# stop stopwatch and update exectime file
$stopwatch.stop();
$exectime = ([math]::Round($stopwatch.elapsed.totalminutes))
$exectime | Out-File $exectimefile
# call script to update the conjob schedule
/bin/bash /home/zerto/workers/updatecron.sh
## End of Main Part
#———————————————————————————————–
#remove the lockfile
Remove-Item $lockfile –Force[/powershell]
So the easy part of the script to read are all the “Start-Job” lines. They are the 10 worker threads that get the stats, but before all of those is some new code. The new code is basically logic to make sure the script isnt already running, stop trying to start a new run.
If you look carefully there are some “stopwatch” lines in there too. Those, along with the “updatecron.sh” script make zPlanner smart.
This is how zPlanner knows how long it takes to get all of the stats, and then updatecron.sh actually changes how often the scripts run. Together they make sure zPlanner gets as granular as possible while not over working the appliance or vCenter.
[stextbox id=’info’]In the future, I will probably modify the vm-getio.ps1 script so that it calls the same vm-getioX.ps1 script with parameters that tell it which thread it is. This will mean I can reduce the number of worker scripts from 10 down to 1, which will simplify code maintenance.[/stextbox]
One last thing that you might have spotted is the PHP script “tocsv.php”. This script is actually generating the lists of VMs that each vm-getio worker script needs to get data for. If you are wondering why I need to regenerate those lists before each stats run, check out the next section.
Dynamically Building the Monitored VM list
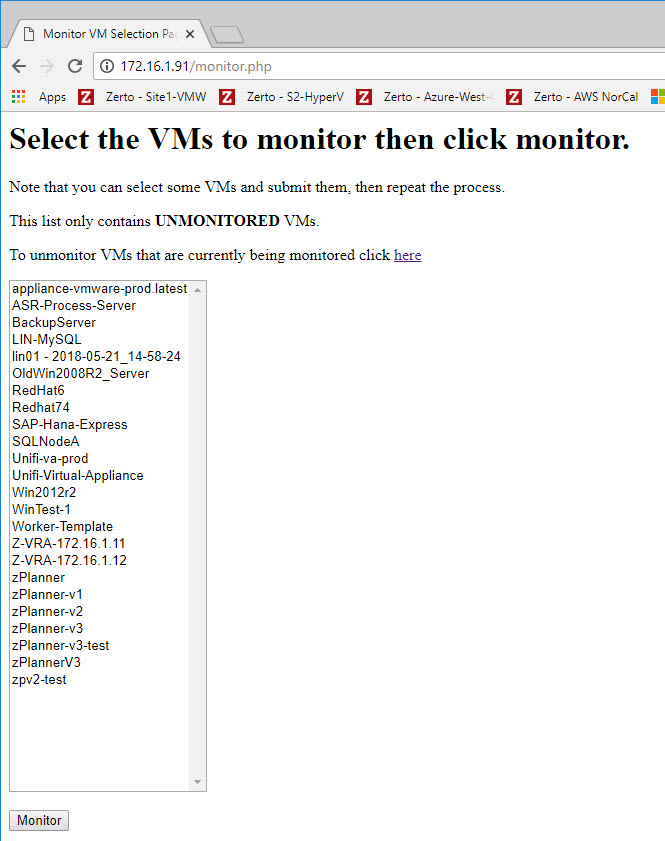
Manually typing in VM names of the VMs you want to monitor doesn’t scale. It’s also prone to errors. So to take as much precaution as possible I also created a really ugly web interface to select which VMs should be monitored.

I told you it was ugly…
But the functionality is exactly what I wanted. Simple, easy to use, vm selection. Simply select one or more VMs and click monitor. You can add and remove VMs at any time with this interface. Which is why I had to make the vm-getio.ps1 script smart enough to rebuild its VM lists before each run.
Behind the scenes, there is a PowerShell script to load all of the VMs into MySQL, where they are all tagged as “Not Monitored”. After someone selects them and clicks “Monitor” all I do is update the database row from “Not Monitored” to “Monitored”. Lastly, the “tocsv.php” script runs a query to select all VMs from the list who are set to “monitor”. Here is that script:
[php]<?php
$csvpath = ‘/home/zerto/data/’;
//delete old CSV files
for ($i = 0; $i < 10; $i++) {
$file = $csvpath . "vmlist" . $i . ".csv";
//need to add if statement to see if it exists before deleteing
if (file_exists($file)) {
unlink($file);
}
}
//connect to the database
$connect = mysqli_connect("localhost","root","Zertodata1!");
mysqli_select_db($connect,"zerto"); //select the table
// get the total number of VMs to be monitored and store in count
$result = mysqli_query($connect, "SELECT * FROM `vms` WHERE `monitor` = ‘Y’") or die(mysqli_error($connect));
$count = mysqli_num_rows($result) or die(mysqli_error($connect));
echo $count . PHP_EOL;
// if monitoring 30 vms or less only use 1 worker
if ($count < 30) {
// store all vms in vmlist0
$csvfile = $csvpath . "vmlist0.csv";
echo $csvfile . PHP_EOL;
$handle = fopen($csvfile, ‘w’) or die(‘Cannot open file: ‘.$csvfile); //implicitly creates file
// write header to csv file
$line1 = ‘"Name"’ . PHP_EOL;
fwrite($handle, $line1);
//go get the VM names from mysql and put them in Csv
$vms = mysqli_query($connect, "SELECT `name` FROM `vms` WHERE `monitor` = ‘Y’ ORDER BY `name`") or die(mysqli_error($connect));
while($row = mysqli_fetch_assoc($vms)) {
$data = ‘"’ . $row["name"] . ‘"’ . PHP_EOL;
fwrite($handle, $data);
}
} else {
// if we have more than 30 vms then we need to figure out how many VMs each worker will have to do. SO total vm count / 10 = number per worker
$perworker = ceil($count / 10);
for ($i = 0; $i < 10; $i++) {
// create a csv file with a 1-10 number before the extension
$csvfile = "vmlist" . $i . ".csv";
$csvfile = $csvpath . $csvfile;
echo $csvfile . PHP_EOL;
$handle = fopen($csvfile, ‘w’) or die(‘Cannot open file: ‘.$csvfile); //implicitly creates file
// write header to csv file
$line1 = ‘"Name"’ . PHP_EOL;
fwrite($handle, $line1);
// figure out where mysql should start looking for VMs
$x = $i * $perworker;
// get the right vms to put in this csv file and write them to the csv
$vms = mysqli_query($connect, "SELECT `name` FROM `vms` WHERE `monitor` = ‘Y’ ORDER BY `name` LIMIT $x, $perworker") or die(mysqli_error($connect));
while($row = mysqli_fetch_assoc($vms)) {
$data = ‘"’ . $row["name"] . ‘"’ . PHP_EOL;
fwrite($handle, $data);
}
}
}
[/php]
As you can see, it’s a little more complex than that, but the complexity is simply to divide the number of VMs into 10 equally sized csv lists. Once this script generates a list of VMs for each of the getio worker threads, PowerShell starts the workers.
So far, this method has proven to work well enough to get zPlanner to the 1000 VM mark with stats collection taking less than 30 minutes per run.
Next up… what do we do with all these numbers?
Displaying the Data
Everything we have talked about up till now has been about acquiring data from VMware. This section talks about what we can do with zPlanner and those stats.
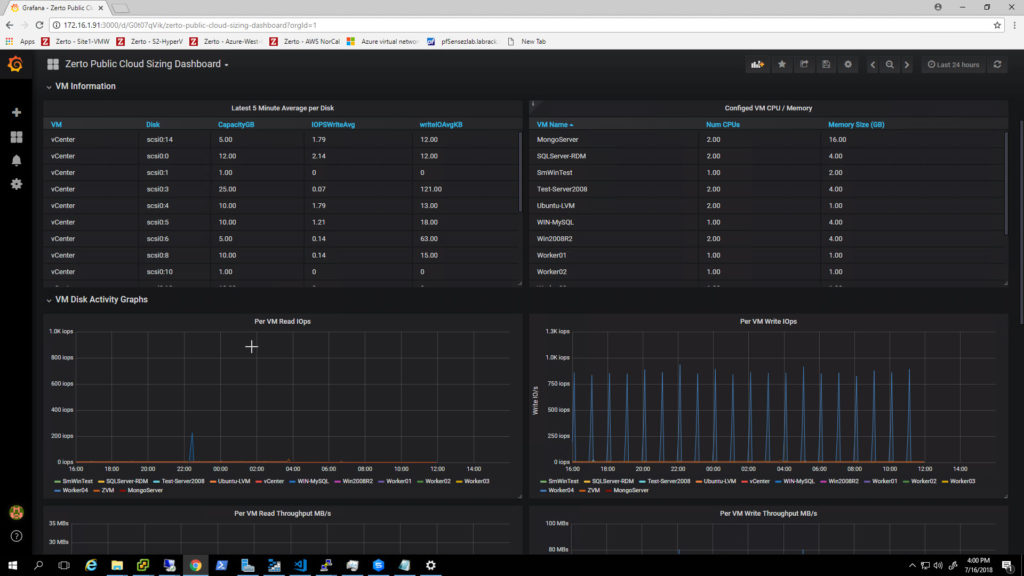
I could have built reports from scratch (and for some use cases I still might) but Grafana is a great open-source platform that can ingest data from almost any source you can think of. It helps you not only display the data, but also helps you build the queries and format the results so the output looks nice too.
I decided to include a section about Grafana for another reason though. Specifically its easy export/import and sharing of dashboards.
This is a dashboard:

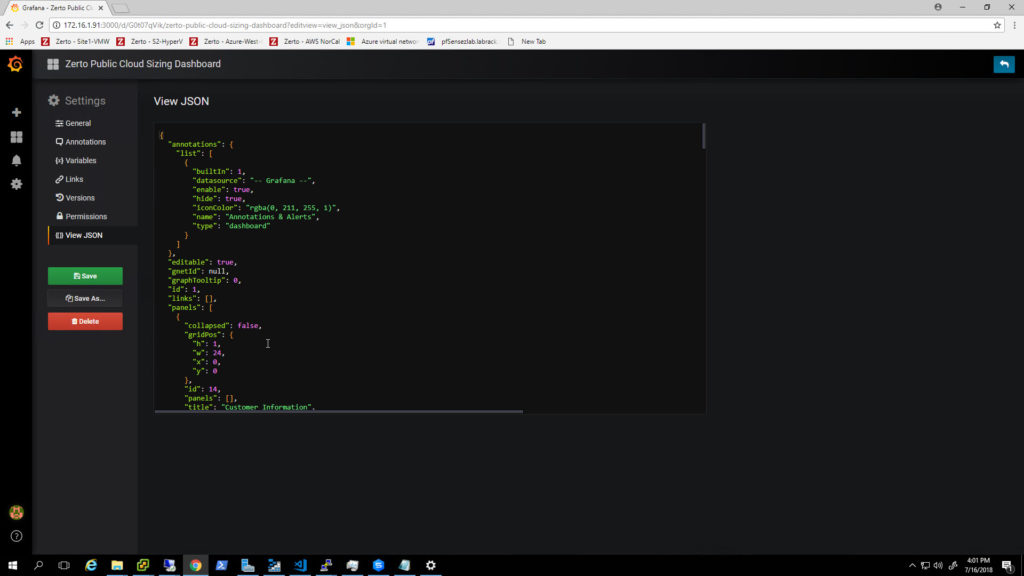
All of the code to make this dashboard work is stored in a JSON file. Grafana makes it very easy to export that JSON file, as well as import it into another instance of Grafana. Why does this matter? Because I make lots of updates to my code. And being able to easily update code on my zPlanner, then share the JSON dashboard code, and have a customer import it, makes the process of building new and improved dashboards simple.

At some point, when I have time to invest more time in learning how to share Dashboards through the Grafana website, I may just push all of them to that, and then there would be no need to import dashboards at the customer side.
Exporting the Data
The last technical topic I wanted to cover was exporting the database from zPlanner. Security is a top concern for many companies, and I wanted to make sure that zPlanner was able to avoid as much red tape as possible. I mention that because my first thought was to have zPlanner ship the stats back to a mothership somewhere so that the nerds at Zerto can look at the data and make recommendations for the customer.
I was quickly reminded by my team that it was probably not a good idea to let data leave the customer site automatically due to security concerns.
I then thought, well if I could create a secure portal where those Zerto nerds could log in and get secure access to the remote zPlanner via VPN… that might work too. But then I was reminded that punching a hole in corporate firewalls and allowing full LAN access to a customer network from a remote location may also be frowned upon.
So, in perfect 21st-century style… I have implemented sneakernet.
Using phpMyAdmin you can export the “zerto” database to an sql file. Then send it to your favorite Zerto SE via email, usb drive, etc. After that, the Zerto sql file can be imported via phpMyAdmin into another instance of zPlanner where the Zerto nerds can analyze away to their heart’s content.
Next Steps
Until I can find a product that is free to use as well as distribute I think zPlanner will live on. Hopefully, I can enlist other geeks to help me develop it and improve code quality as well as efficiency too.
As I stated in my other zPlanner article I think my next steps are to get some really cool dashboards finished up (so if your reading and you have in-depth knowledge of building SQL queries I could use your help). After that, I want to get VPG planning rolled into zPlanner too so that you can select a group of VMs, mark it as a VPG, and get dashboard stats and reports on a per VPG level.
And at the end of all of that it would be super cool to take those VPG settings from zPlanner, and with the push of a few buttons, send a REST API command to ZVM to build out the real VPG and get your data replicating.
Want to contribute?
If you know PowerShell / PowerCLI, BASH, PHP, MySQL I invite you to take a look at the code of this project. It is all available on my GitHub repository here. If you find something I could do better submit a pull request and I’ll take a look.
If you would like the OVA file, I ask that you use the Drift Chat plugin in the lower right corner to drop me a note.
If you want to be kept updated on zPlanner announcements add yourself to the mailing list with the form below.
[mautic type=”form” id=”14″]
![]()


