By the end of this article, I’m going to show you to visualize nearly every Zerto ZVM metric using Prometheus and Grafana. Think of this project like an open-source Zerto Analytics that you can self-host inside your own datacenter!
Until someone can come up with a catchy name, I settled on “Zerto Resiliency Observation Console” or Zroc for short. The project is currently hosted on the Zerto GitHub page.
Disclaimer
Before we get started let’s set a few ground rules. This project is something I started to solve a problem for a customer. Over time I found new use cases (visualizing the ZVM Encryption Detection API data) and then it became a challenge to extract all integer-based metrics from the ZVM API and get them into the Prometheus database.
With that said, this is not a Zerto product, it is not supported by Zerto Support, nor was it developed by Zerto developers. Do not call Zerto support and expect them to help you set this up.
Also, this project ONLY leverages Zerto APIs and vCenter APIs and only requires read access to all of the APIs it uses. It NEVER posts data to ZVM or vCenter. (ie, it is read-only and has no API calls that can affect either platform that would cause data loss or corruption) However, for CYA purposes, usage of this or any other open-source product is at your own risk, and I take no responsibility if you blow up your stuff due to improper usage or whatever else.
Architecture
This project leverages Docker and several open-source components to extract data from the ZVM API:
- ZVMExporter – python code written by me, released as open-source, to extract data from the ZVM REST API
- Prometheus – is an open-source time series database. It stores the extracted metrics.
- Grafana – is an open-source visualization platform that pulls data from Prometheus and makes it pretty using various dashboards.
To make all of this work the project leverages Docker and a docker-compose file so that anyone can easily stand this up on their own without messing with Python or any of the other individual components.
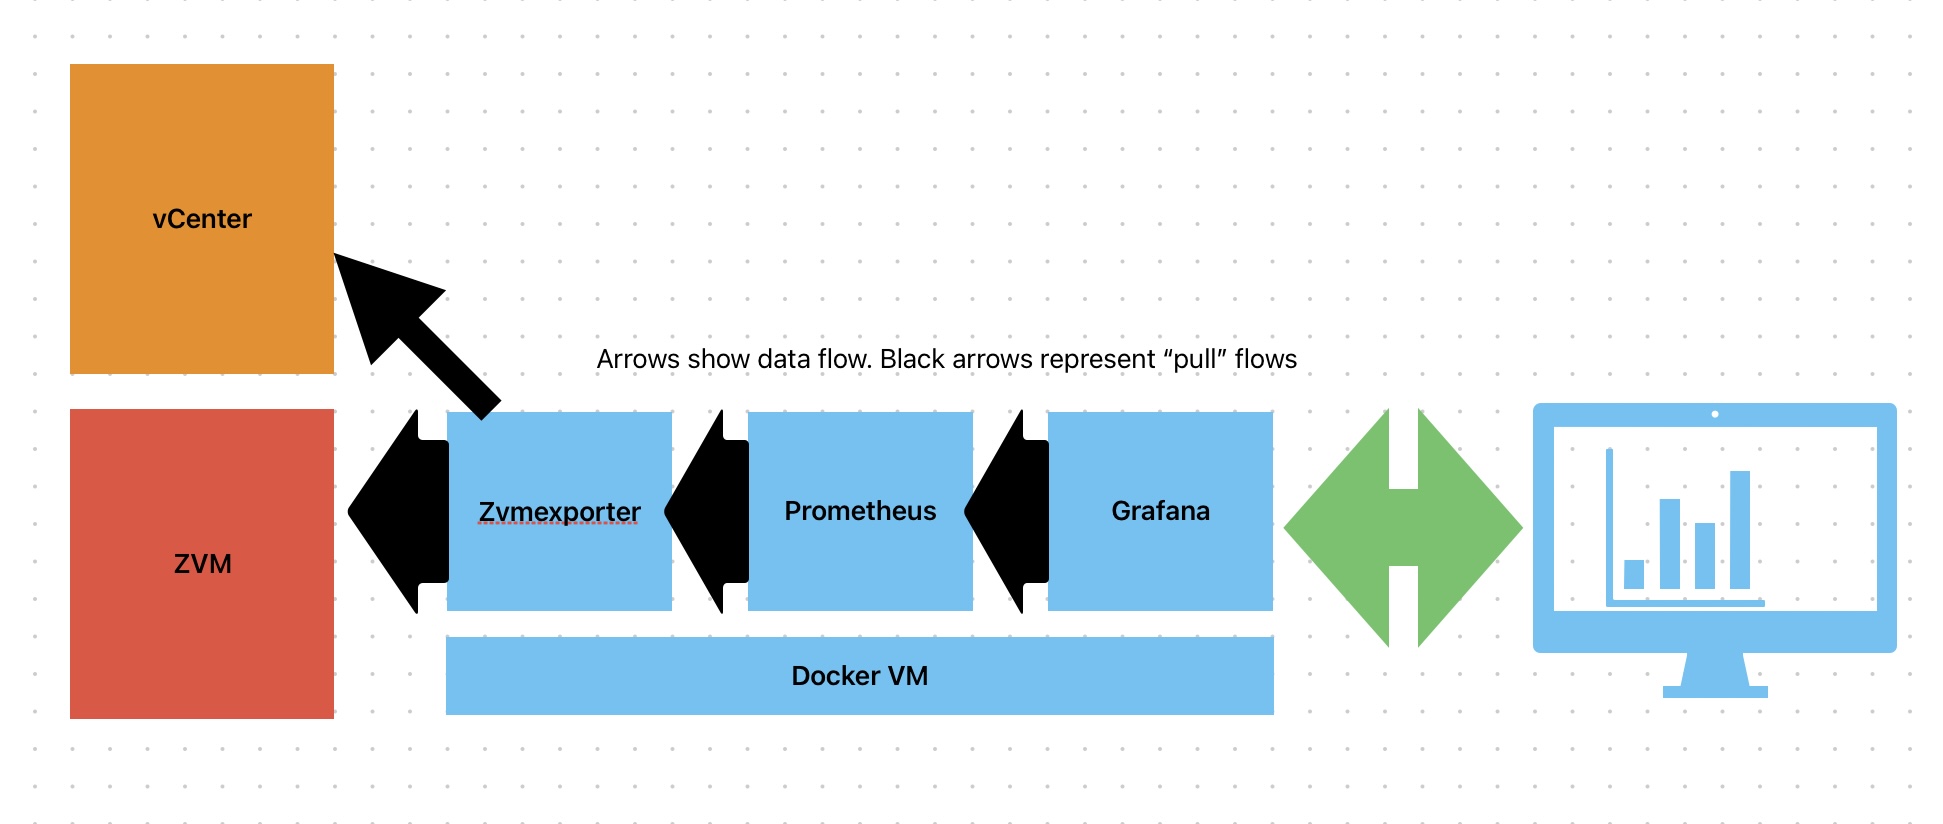
This diagram shows arrows starting at the object requesting data and points at the object which will supply the data.
The ZVMExporter scrapes data from the ZVM REST API. Then Prometheus scrapes data from the ZVM Exporter. Grafana then gets the data from Prometheus. Currently, the ZVM Exporter exports 67 different metrics!
The ZVMExporter also asks vCenter for CPU and Memory metrics for all VRA VMs too, which is why you see a line pointing to vCenter. Again, you only need read-only rights to vcenter in the ZVMExporter.
Lastly, administrators use their device to access Grafana Dashboards, the arrow shows that you can retrieve metrics but also store custom dashboards.
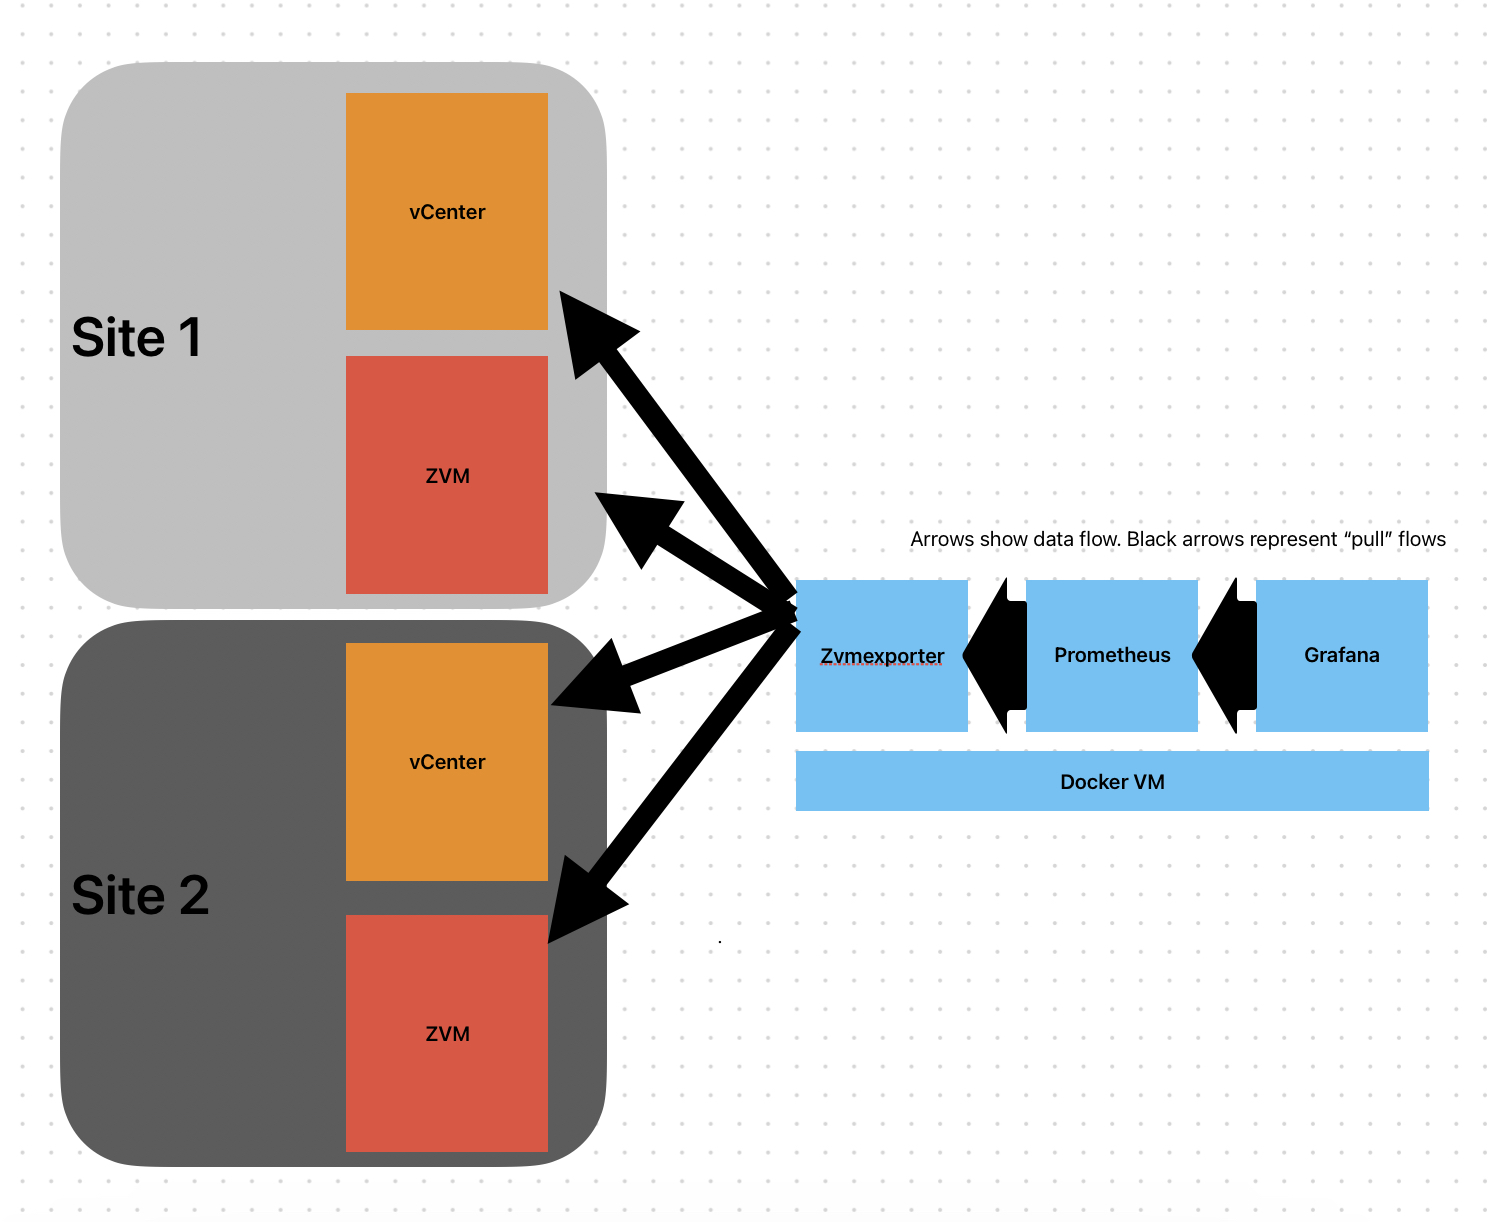
Multi-Site Single Pane of Glass
Zroc is designed to monitor multiple ZVMs and put all of the metrics into the same Prometheus database so that later you can display those metrics in the same Grafana instance. Think SINGLE PANE OF GLASS!
How to set things up
For those familiar with docker and docker-compose yaml files I would encourage you to head over to the GitHub project page and clone it to a Linux machine running docker and get started. For those who are new to docker read on to learn how to do that.
Step 1 – Create a place to run the containers
I personally prefer Ubuntu for most of my projects, but feel free to use any Linux OS. You will need about 2 vCPUs and 2+GB of RAM depending on how large of an environment you have. I typically use about 50GB of HDD space, but I thin provision the disk because storing metrics doesn’t take up too much room.
After installing Linux on a VM, configure it with a static IP address, and then install git, docker, and docker-compose on the machine.
Step 2 – Clone the git repo
Now run the command to clone the git repository to your new Linux host then cd into the new directory.
git clone https://github.com/zertopublic/zroc.git
cd zroc
Step 3 – Edit docker-compose.yaml
Here we will need to first edit the docker-compose.yaml file. This file contains all of the configuration information for each of your ZVMs and each vCenter server.
For each customer, you need to configure a zvm-exporter container.
zertoexporter1:
    container_name: zvmexporter1
    hostname: zvmexporter1
    image: recklessop/zerto-exporter:stable
    command: python python-node-exporter.py
    ports:
      - "9999:9999"
    volumes:
      - ./zvmexporter/:/usr/src/app/logs/
    environment:
      # Site 1 configuration settings
      - VERIFY_SSL=False
      - ZVM_HOST=192.168.50.60
      - ZVM_PORT=443
      - SCRAPE_SPEED=20
      - CLIENT_ID=api-script
      - CLIENT_SECRET=js51tDM8oappYUGRJBhF7bcsedNoHA5j
      - LOGLEVEL=DEBUG
      - VCENTER_HOST=vcenter.local
      - VCENTER_USER=[email protected]
      - VCENTER_PASSWORD=password
    networks:
      - back-tier
    restart: always
Above each of the BOLD items should be changed to what is needed for your environment. I won’t explain how to create a keycloak client_id and client_secret in this article, but I have blogged about it before here. The line that has “9999:9999” needs to have the first 9999 edited. This is the TCP port on the docker host that the ZVM exporter will expose on your network. This port is handy if you want to look at log files, or raw metric data. For zvmexporter2 you might want to make it 9998 and for the third maybe 9997.
Also notice that “zertoexporter1” and “zvmexporter1” are bold, this is because you need to change all three fields for each ZVM you want to monitor. So if you have three ZVMs, you will need three instances of the code above in your docker-compose.yaml file and each section should be:
zertoexporter1, zertoexporter2, zertoexporter3 – each which would have zvmexporter1 … 2 …3 as the container_name and hostname, respectively.
Step 4 – Edit the prometheus.yaml file
In the prometheus folder you will find a prometheus.yaml file which tells Prometheus which targets (zvmexporters) to pull data from.
global:
  scrape_interval:     60s
  evaluation_interval: 60s
  scrape_timeout: 60s

scrape_configs:
  - job_name: 'vm-stats'
    scrape_interval: 30s
    scrape_timeout: 20s
    static_configs:
         - targets: ['zvmexporter1:9999']
         #- targets: ['zvmexporter2:9999']

  - job_name: 'encryption-stats'
    scrape_interval: 30s
    scrape_timeout: 20s
    metrics_path: /statsmetrics
    static_configs:
         - targets: ['zvmexporter1:9999']
         #- targets: ['zvmexporter2:9999']

  - job_name: 'thread-stats'
    scrape_interval: 30s
    scrape_timeout: 20s
    metrics_path: /threads
    static_configs:
         - targets: ['zvmexporter1:9999']
         #- targets: ['zvmexporter2:9999']

  - job_name: 'vra-stats'
    scrape_interval: 30s
    scrape_timeout: 20s
    metrics_path: /vrametrics
    static_configs:
         - targets: ['zvmexporter1:9999']
         #- targets: ['zvmexporter2:9999']
There are four “jobs”, each job monitors a different part of the ZVMExporter. So for each ZVM you monitor you need to add a target under each of the four jobs. In the example above, one exporter (zvmexporter1) is already configured, and a second (zvmexporter2) is there, but commented out. If you want to monitor a second ZVM you should uncomment it under each job. If you need a third or fourth ZVM monitors you will need to add a third or fourth target to each job.
Step 5 – Start the containers
Once you save those configuration files you should be ready to start the containers. Do that from the main zroc directory by issuing the docker-compose up command
docker-compose up -dStep 6 – Check the ZVM Exporters
Once docker pulls all of the containers and starts them, you should be able to browse to various services that are running to check their status.
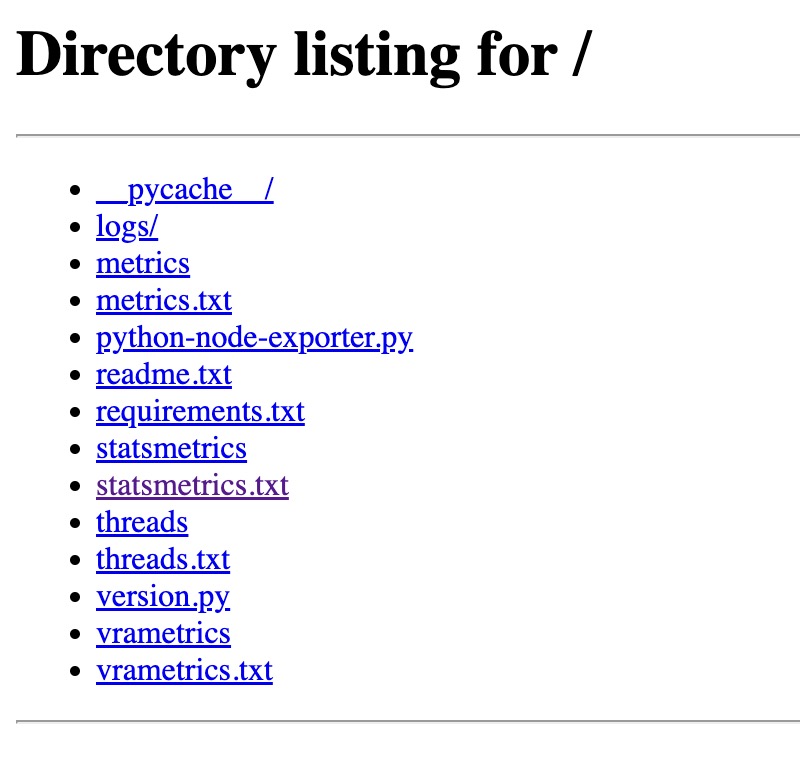
To check the exporters, use a browser to connect to http://<docker-host-ip>:9999 (or 9998 or 9997 if you have more than one exporter)
There should be several txt files with metric data in them. There is also a “logs” directory where you will find logging data from the exporters.
If your exporters have generated the four txt metric files, and there looks to be data in them, the next thing to check on is Prometheus. That service runs on port 9090, so check it with a browser by navigating to http://<docker-host-ip>:9090
If you click “Status” then “Targets” you will see all of the things Prometheus is trying to talk to. They should all be green
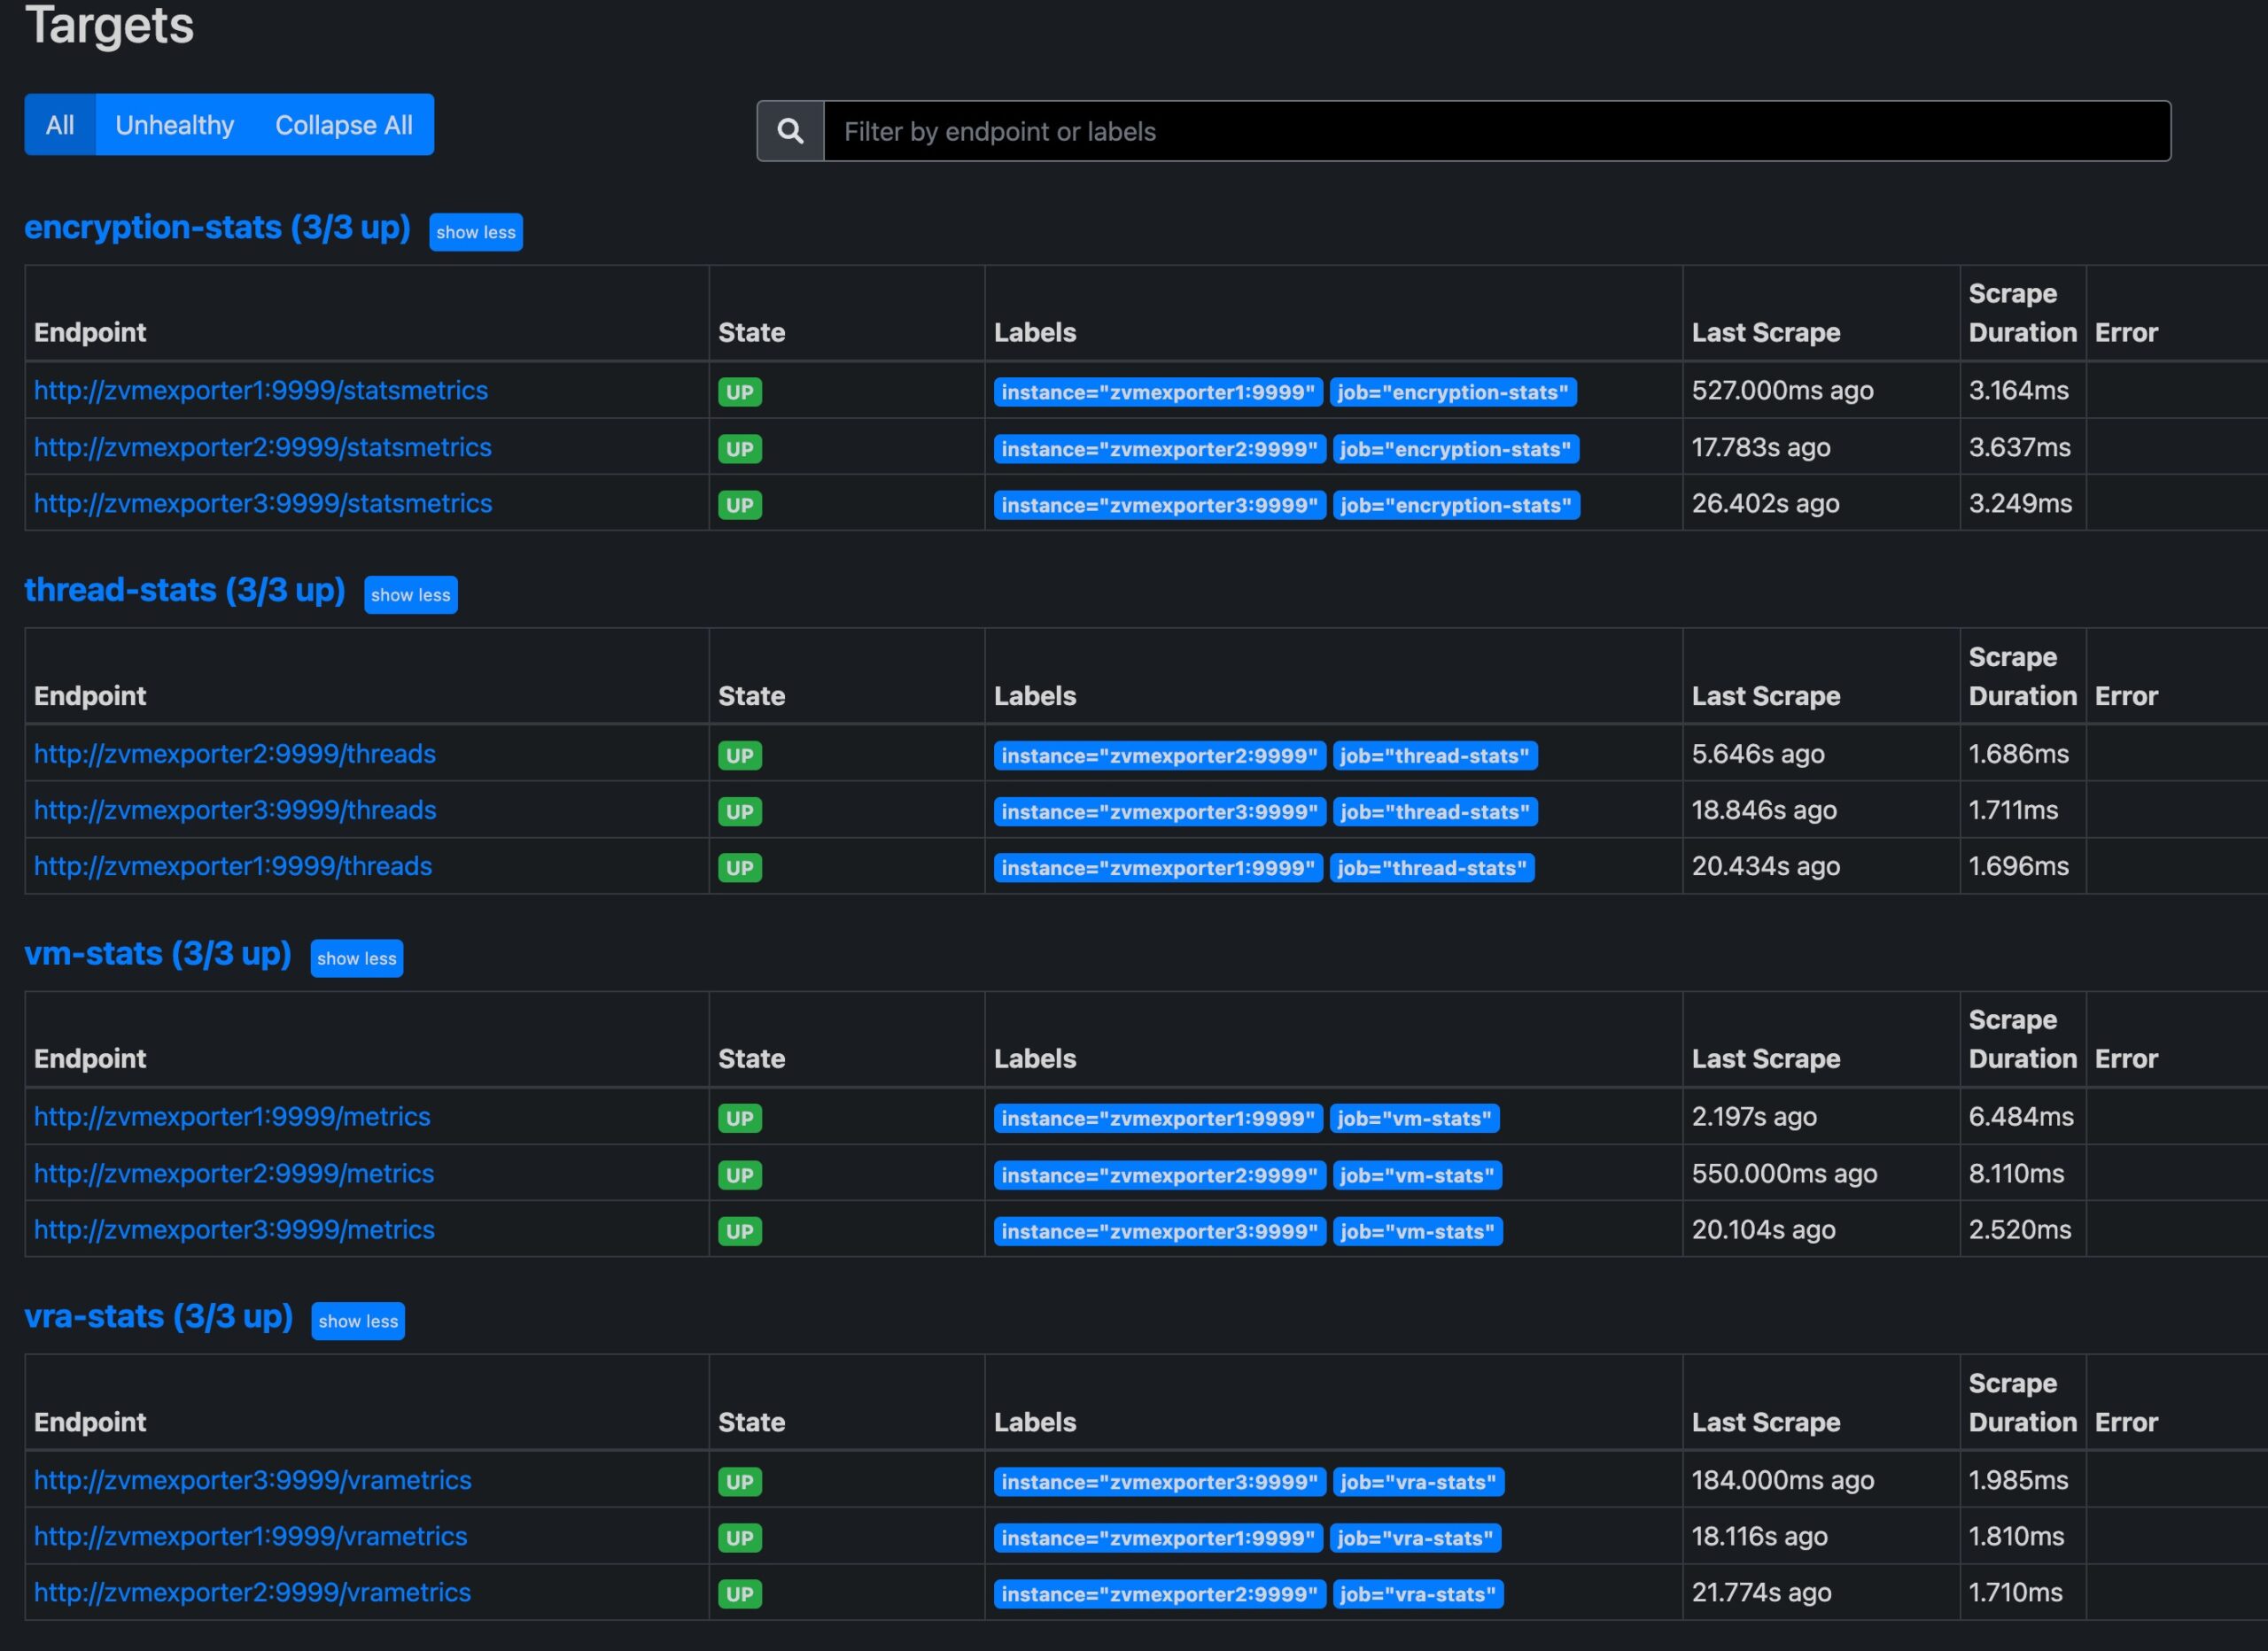
ProTip – Give things about 5 minutes to settle down if some of the targets are reporting as down, or if some data is missing from Grafana but things are showing as “up” in Prometheus.
Step 7 – Grafana!
The last thing to check is Grafana, the default username is admin, and the password is set in the docker-compose.yaml file. By default it is zertodata
The dashboards are all located in the dashboard menu on the left side of the Grafana home page.
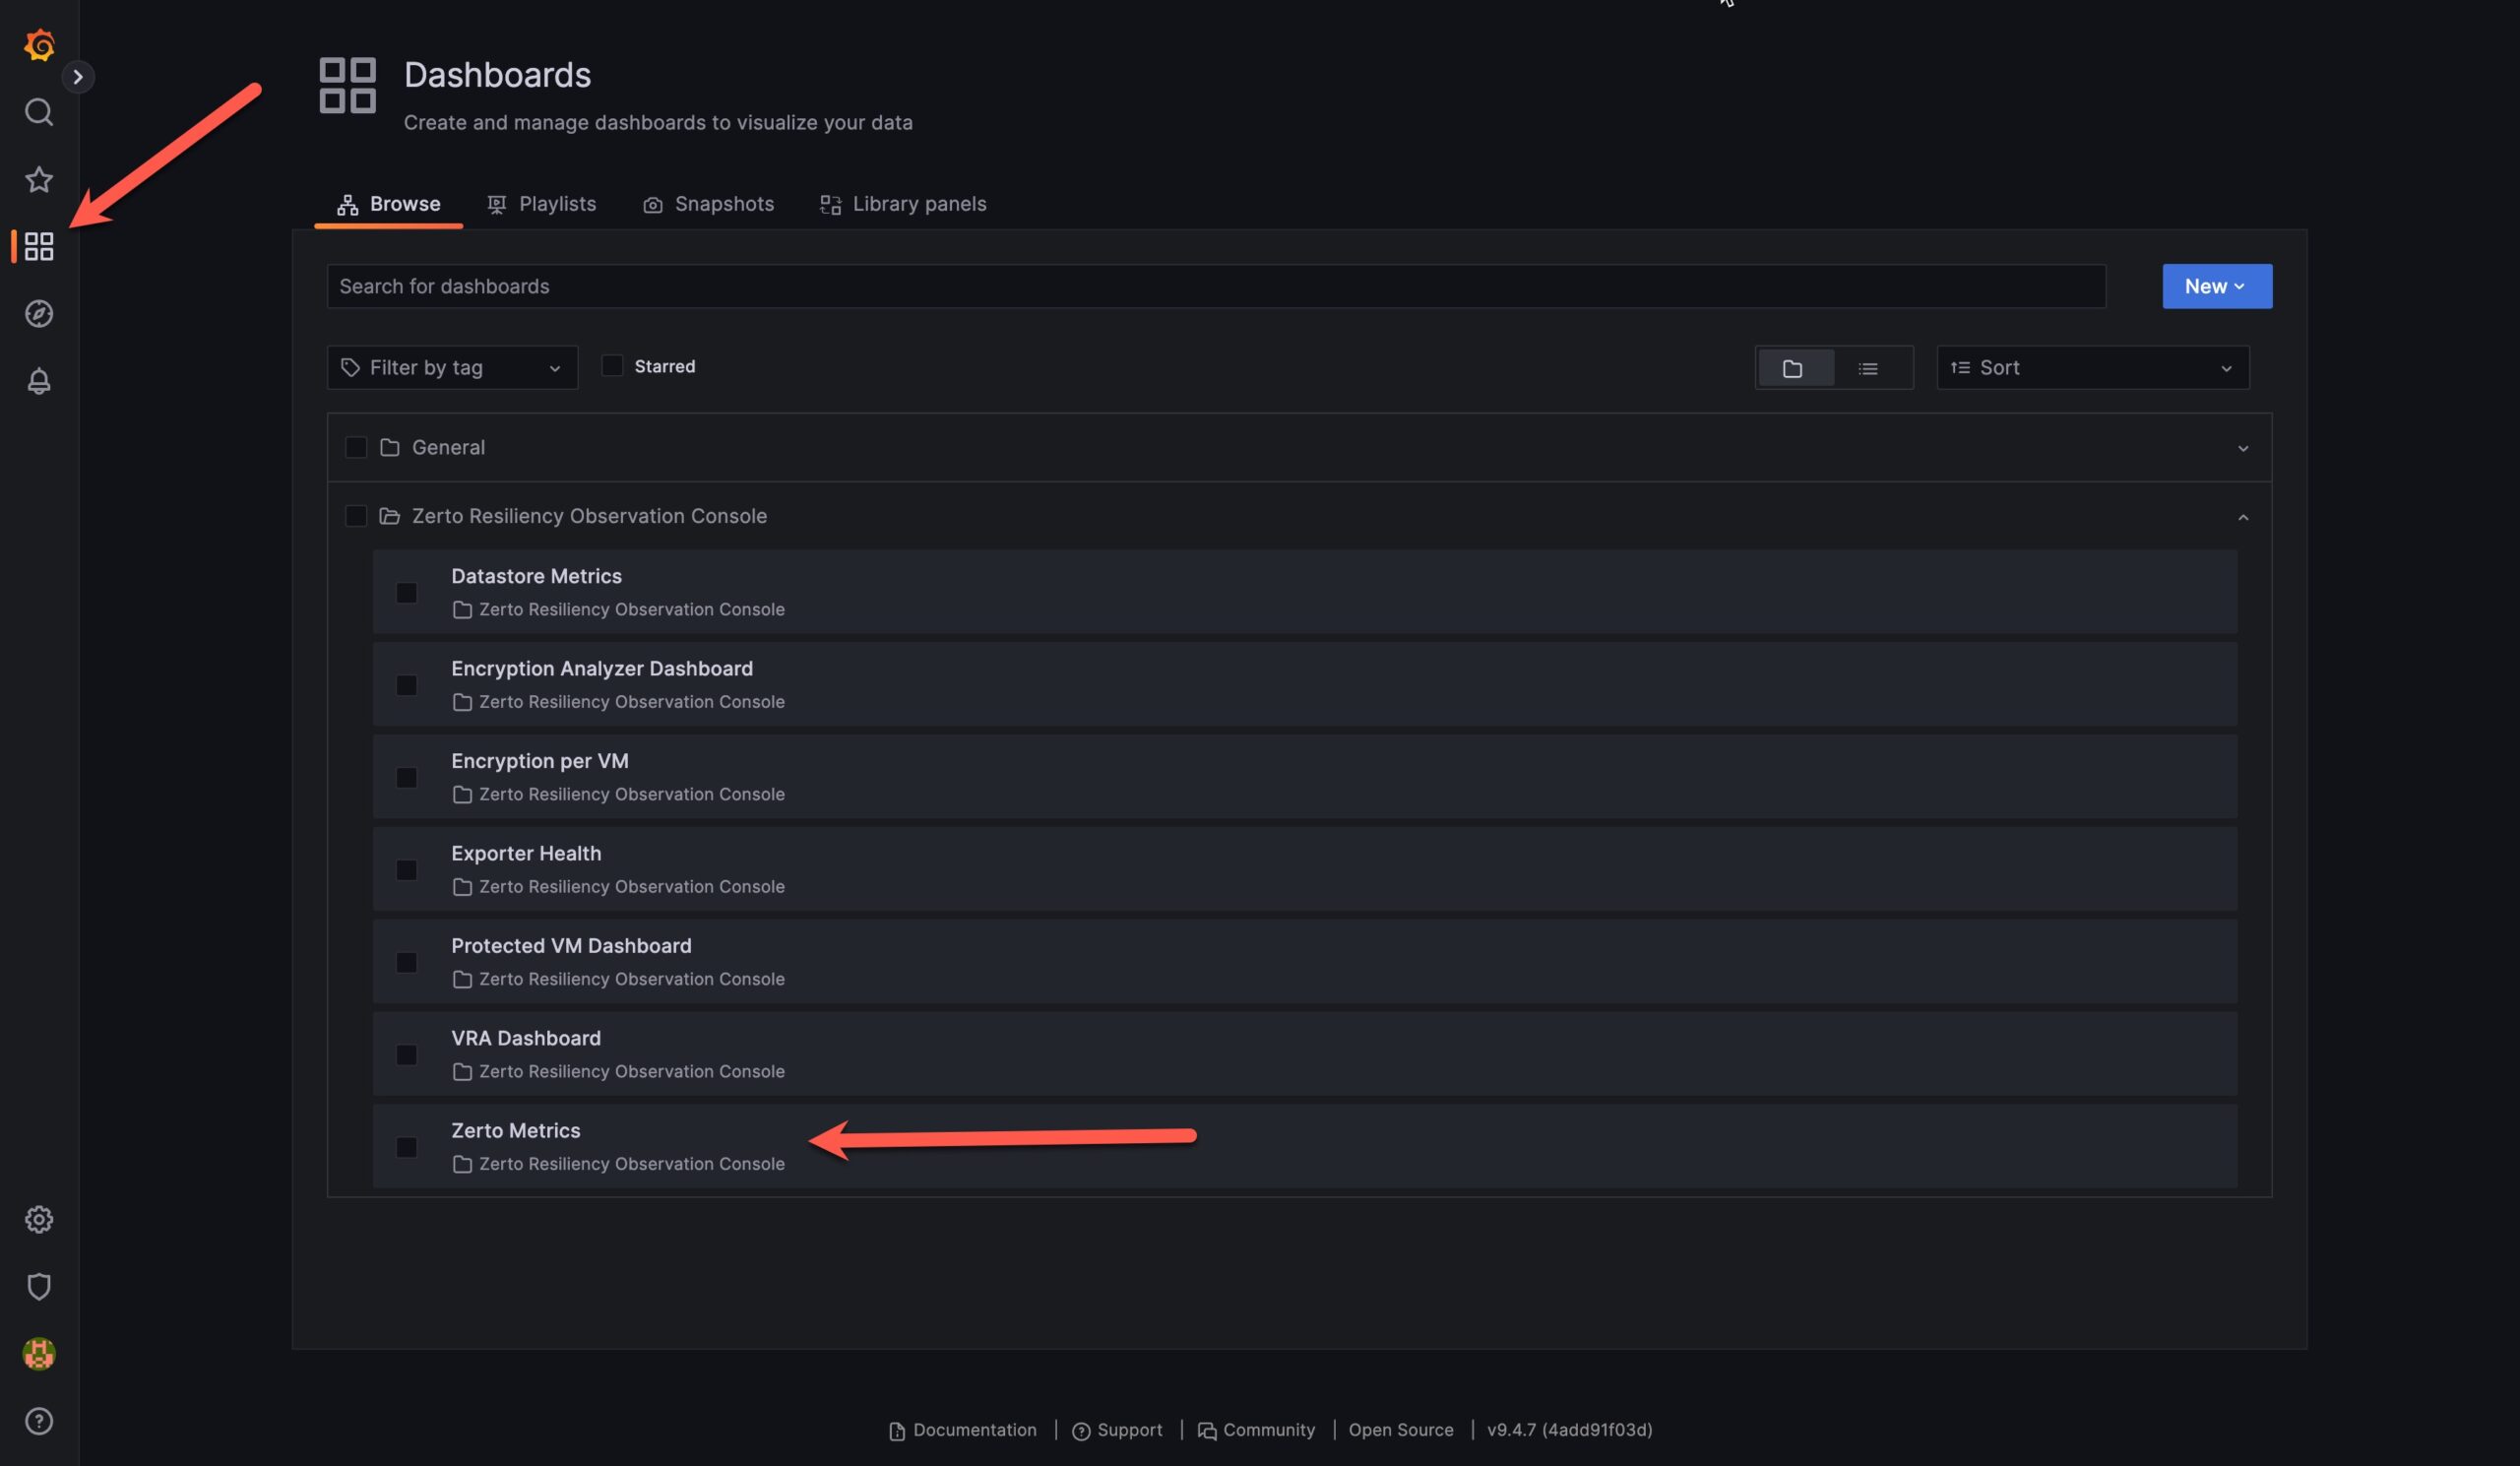
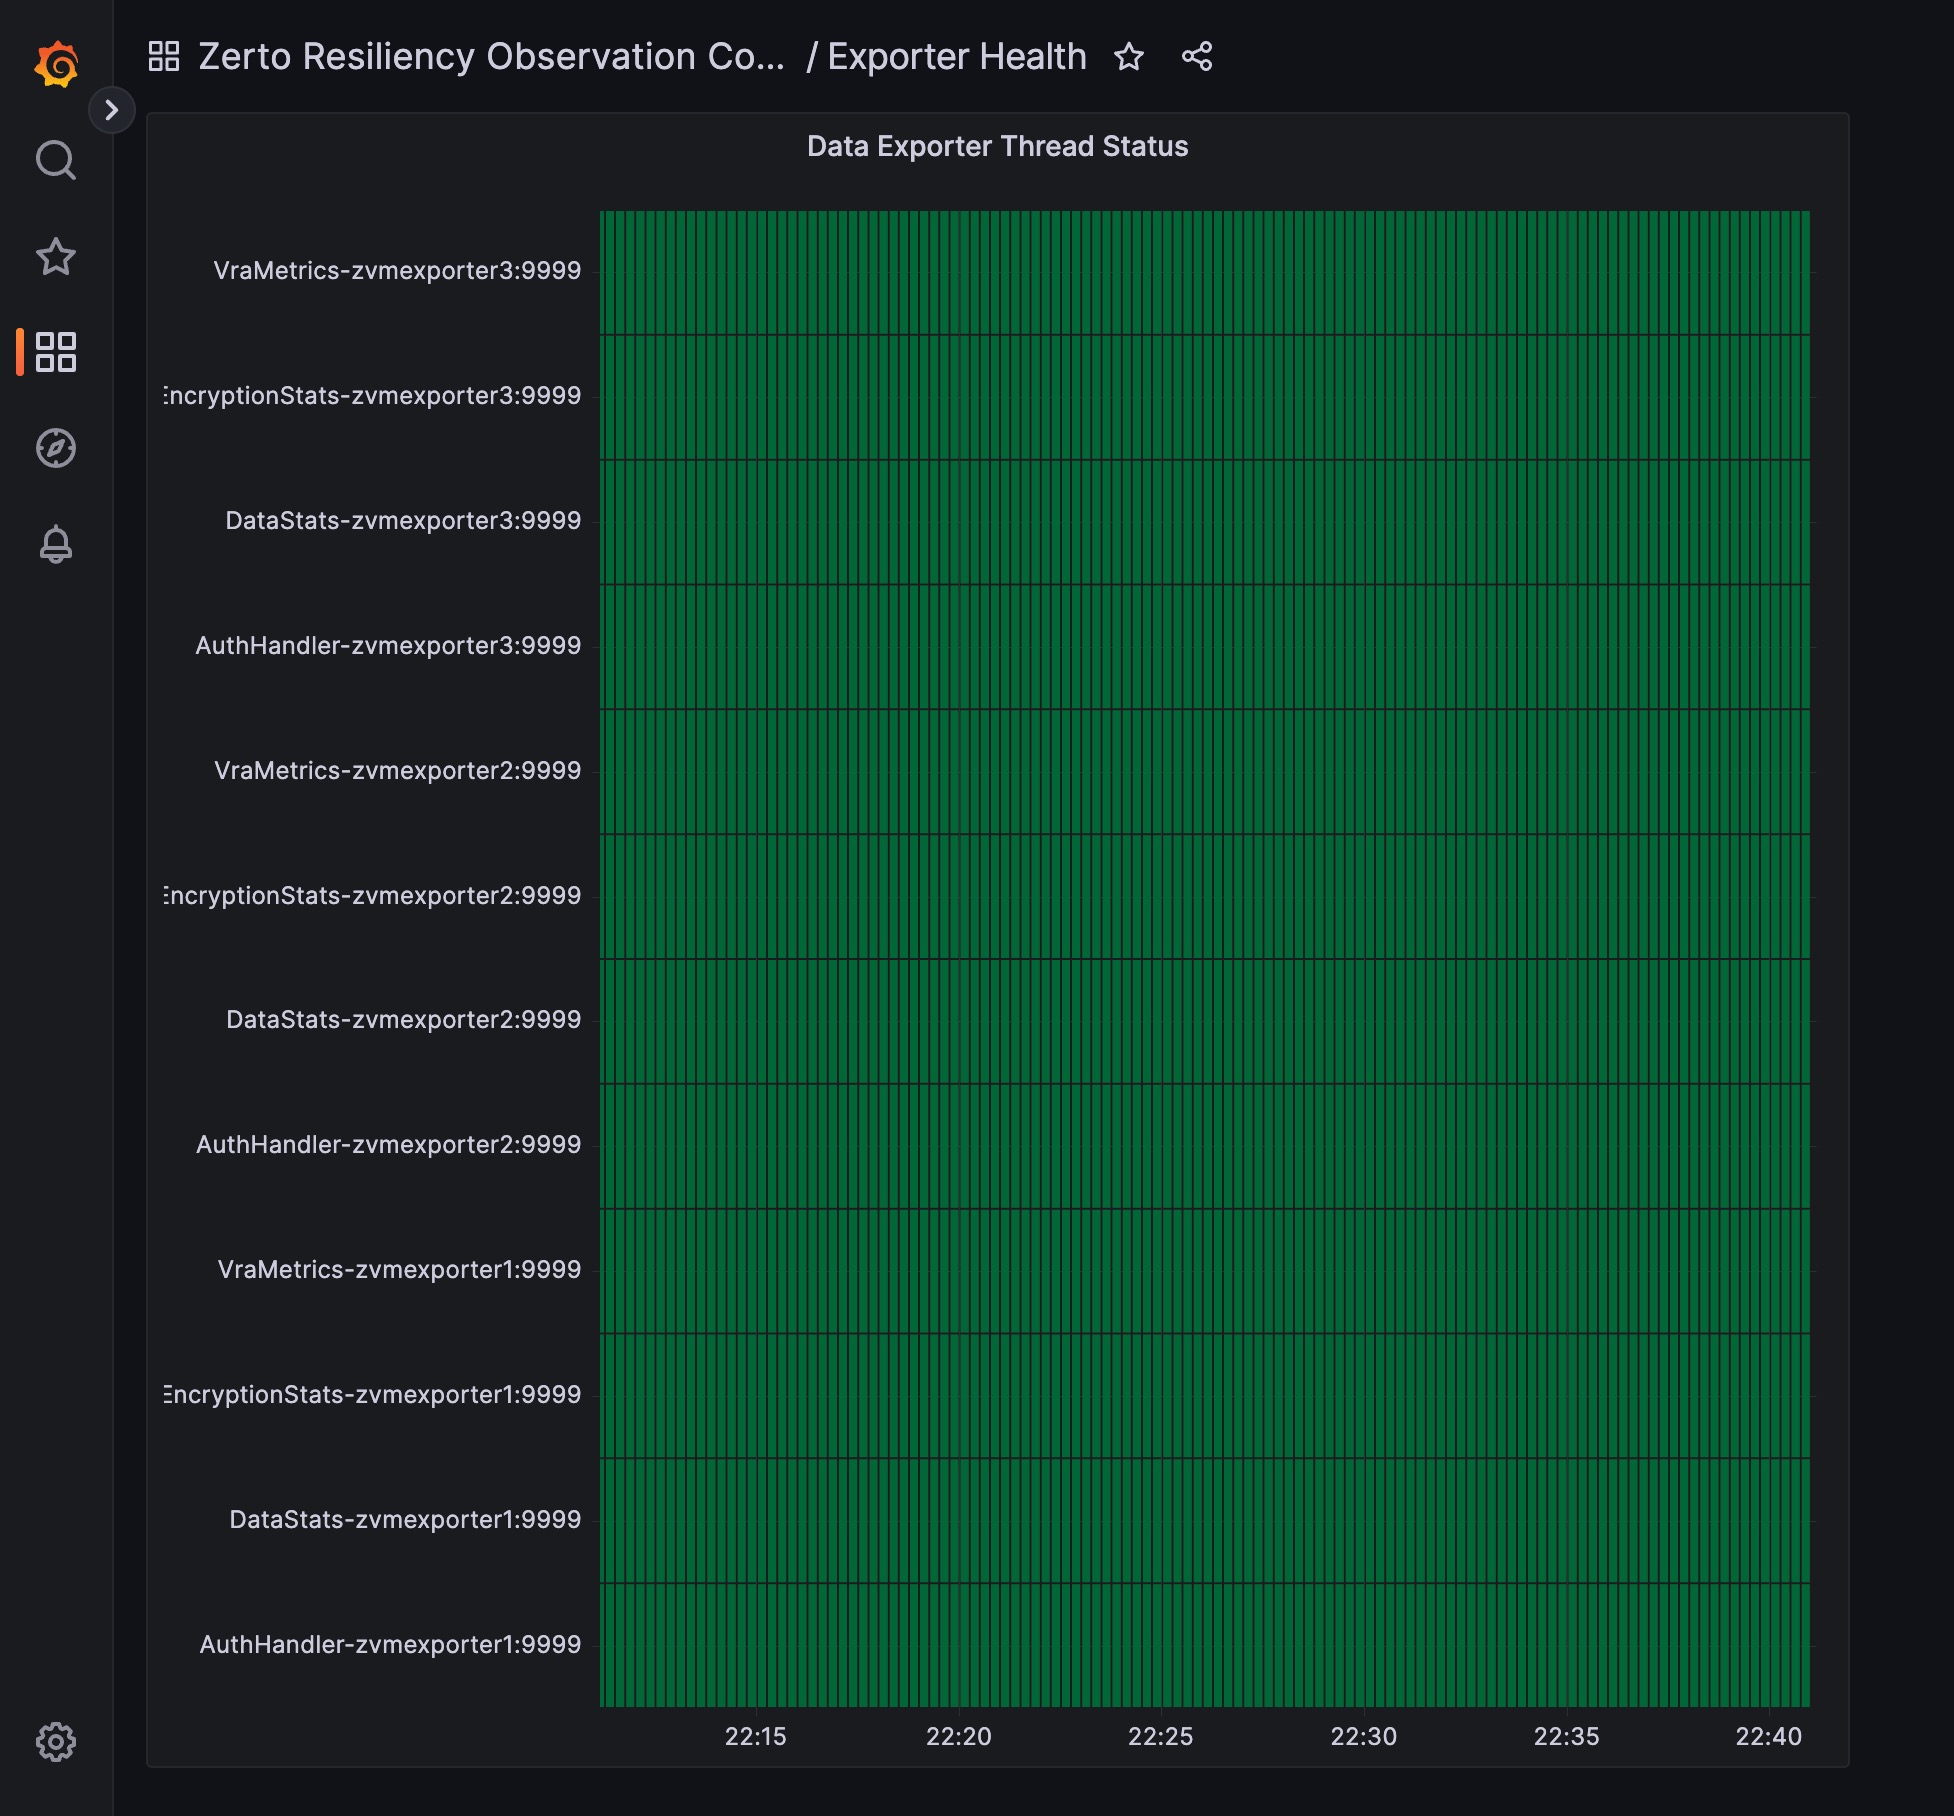
There is also a dashboard that monitors the exporters too if you are interested in if all the threads are working. Each exporter is multi-threaded and has a thread for each group of APIs that it is pulling from.
Summary
At this point, you should have a single pane of glass monitoring console for all your Zerto ZVMs that is self-hosted and stores data for as much as a year.
Remember, this project is open-source, so if you are able to contribute I personally invite you to help make this project better. Maybe you have developed a really cool dashboard, or maybe you can help improve the exporter logic, or maybe the docs I’ve written are horrible and you want to help make them more clear… everything helps.
Lastly, if you see something missing, please leverage the GitHub Issues link to open a ticket for a new feature or a problem you are having.
Thanks for reading!
Dashboards included in this project
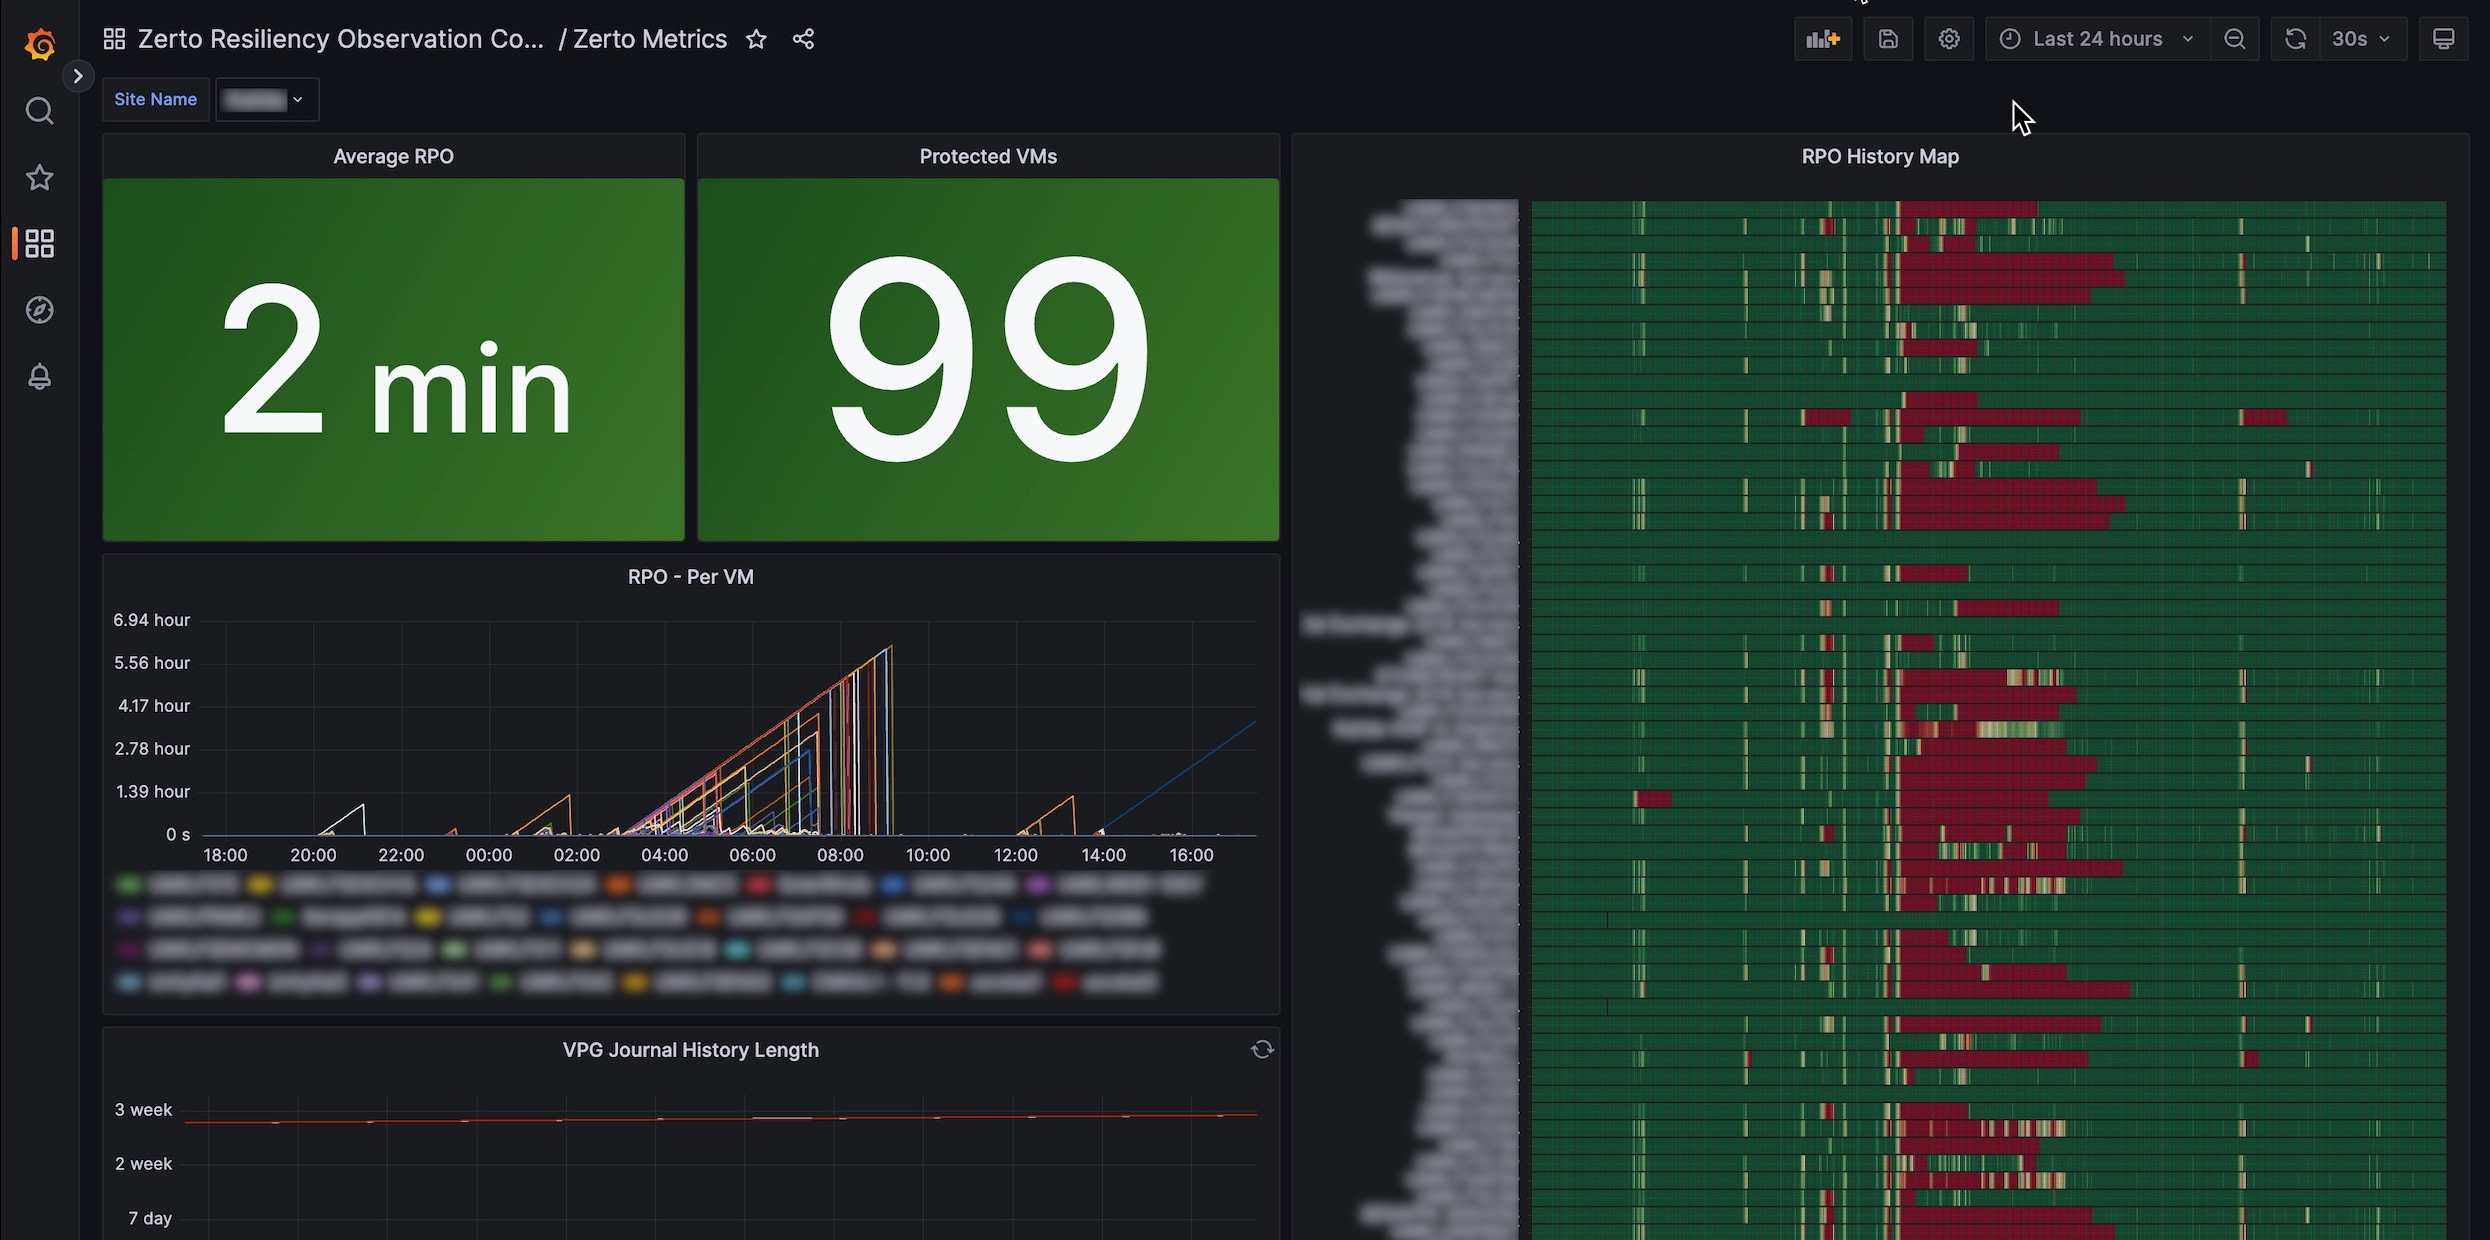
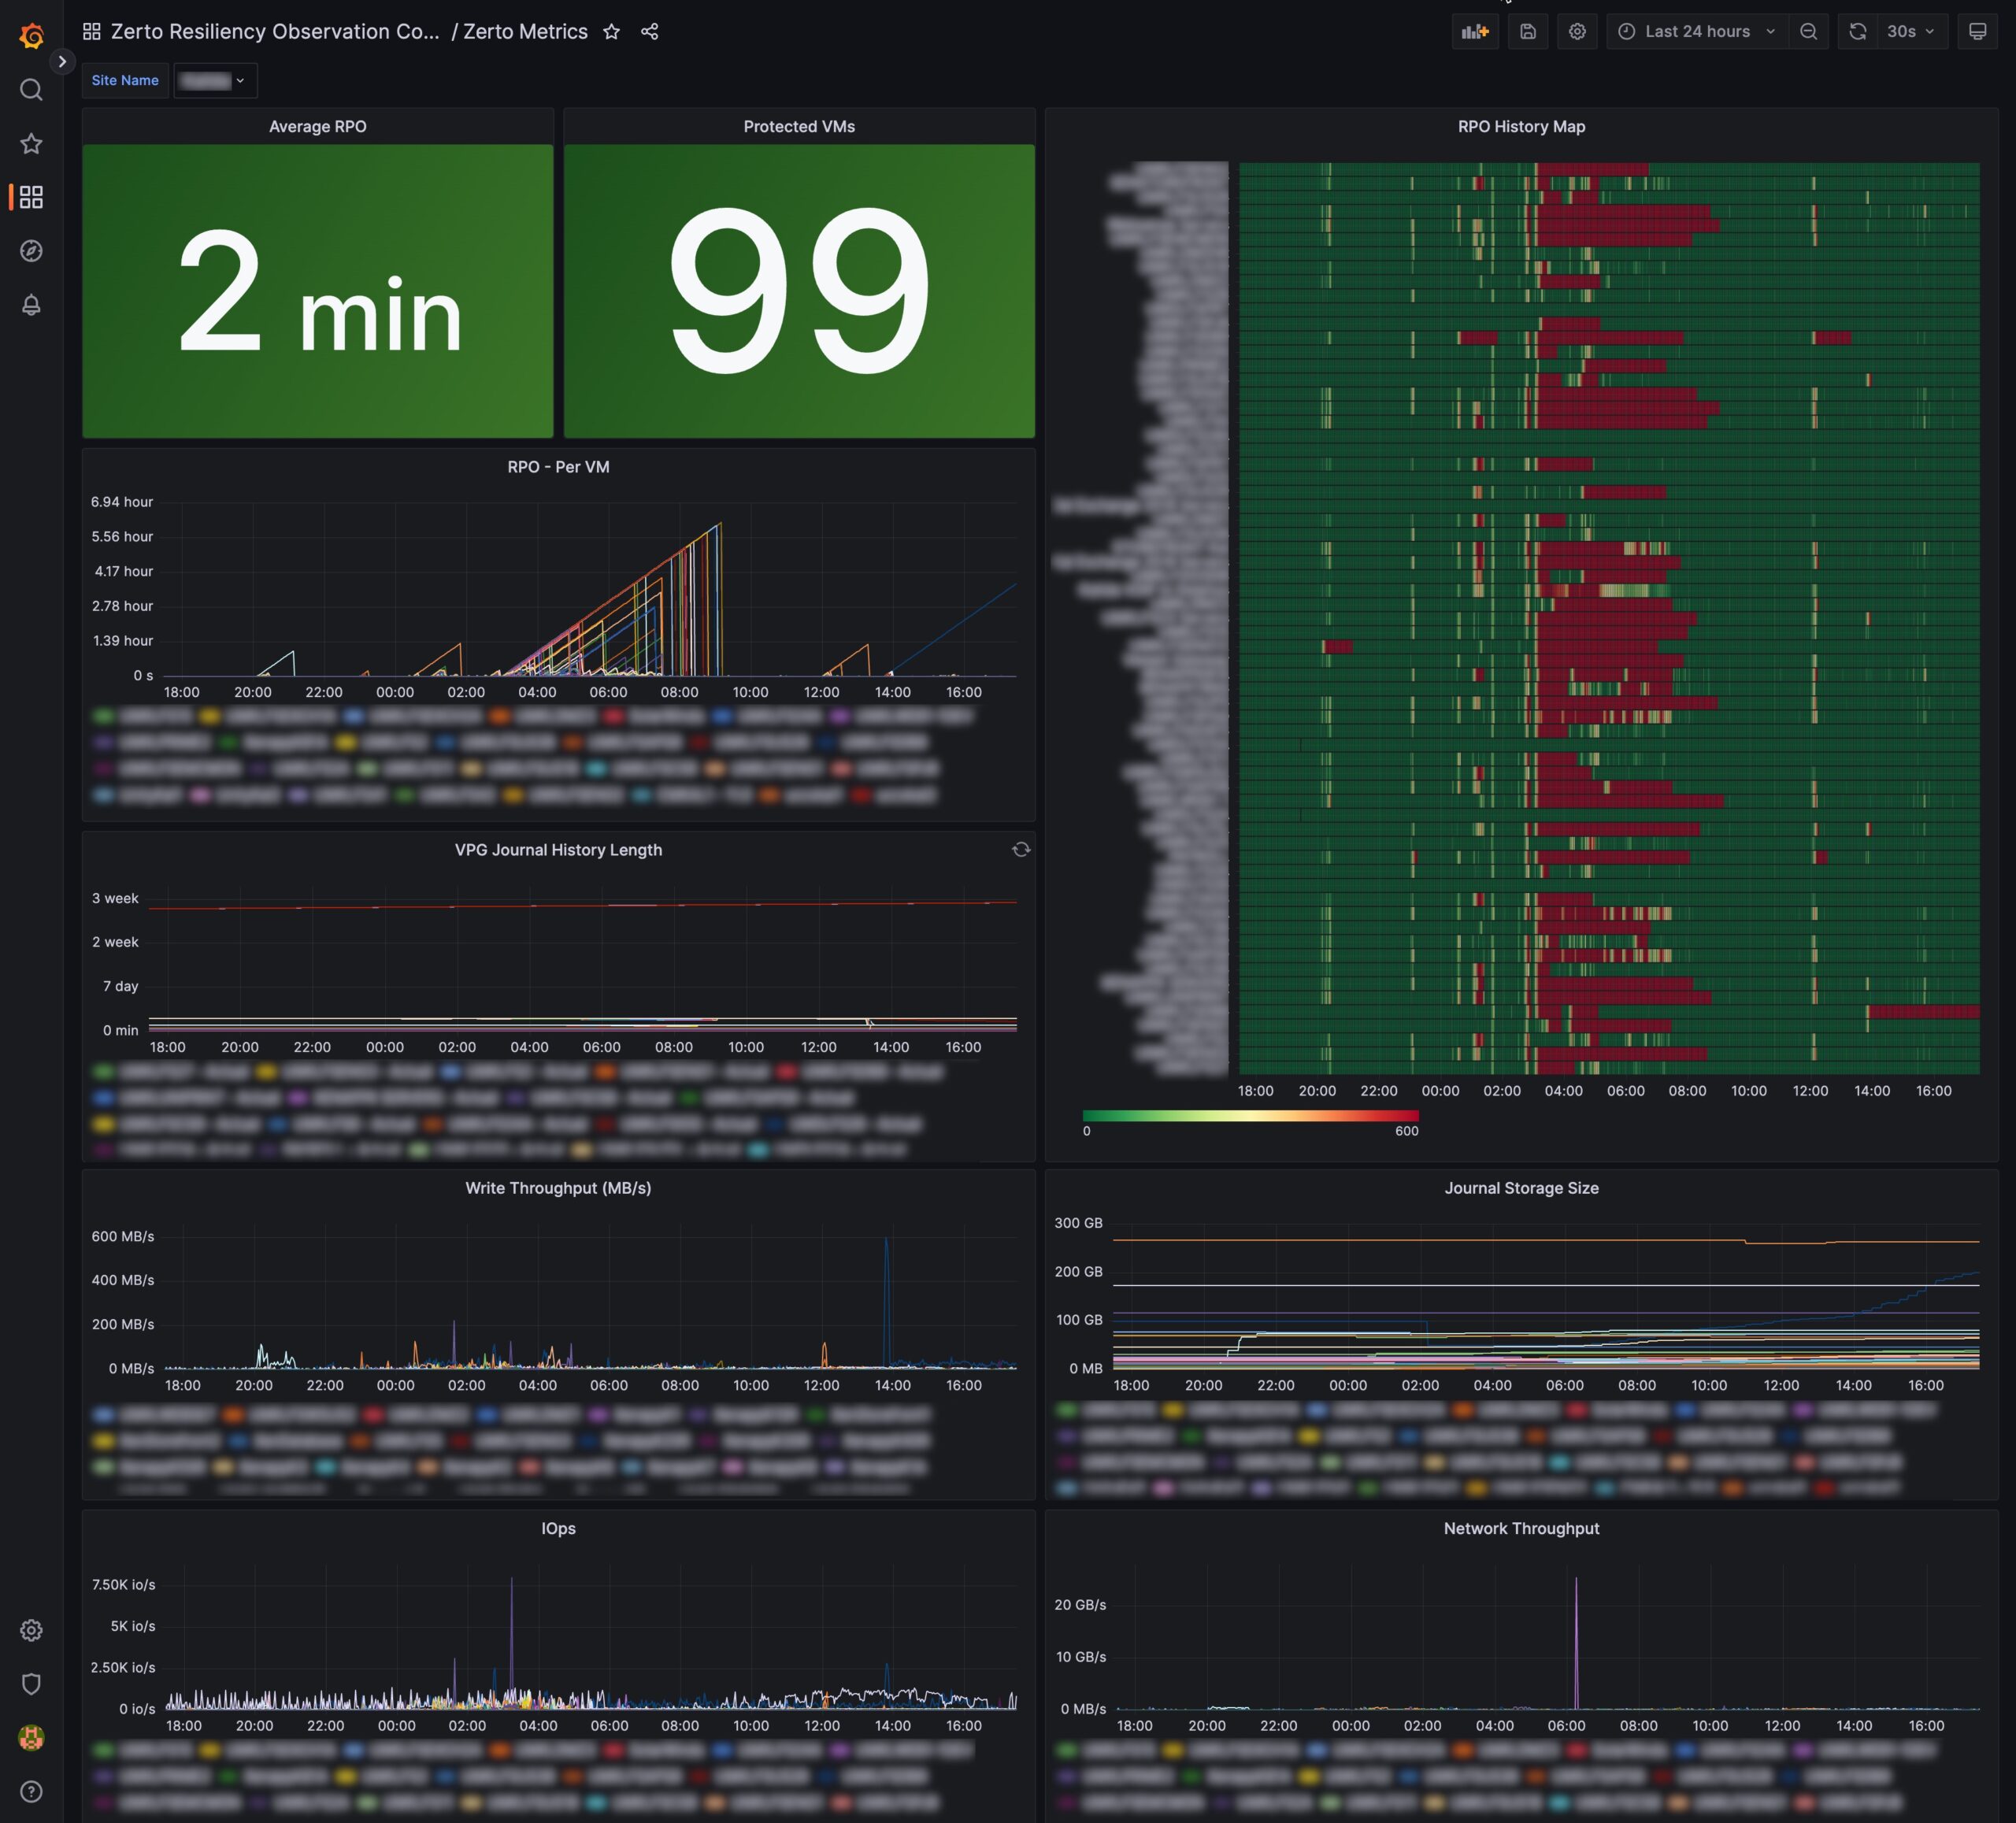
Here are some examples of the dashboards included in this project.
Main Metrics Dashboard, showing RPO history as well as Journal length Journal Size, and throughput.
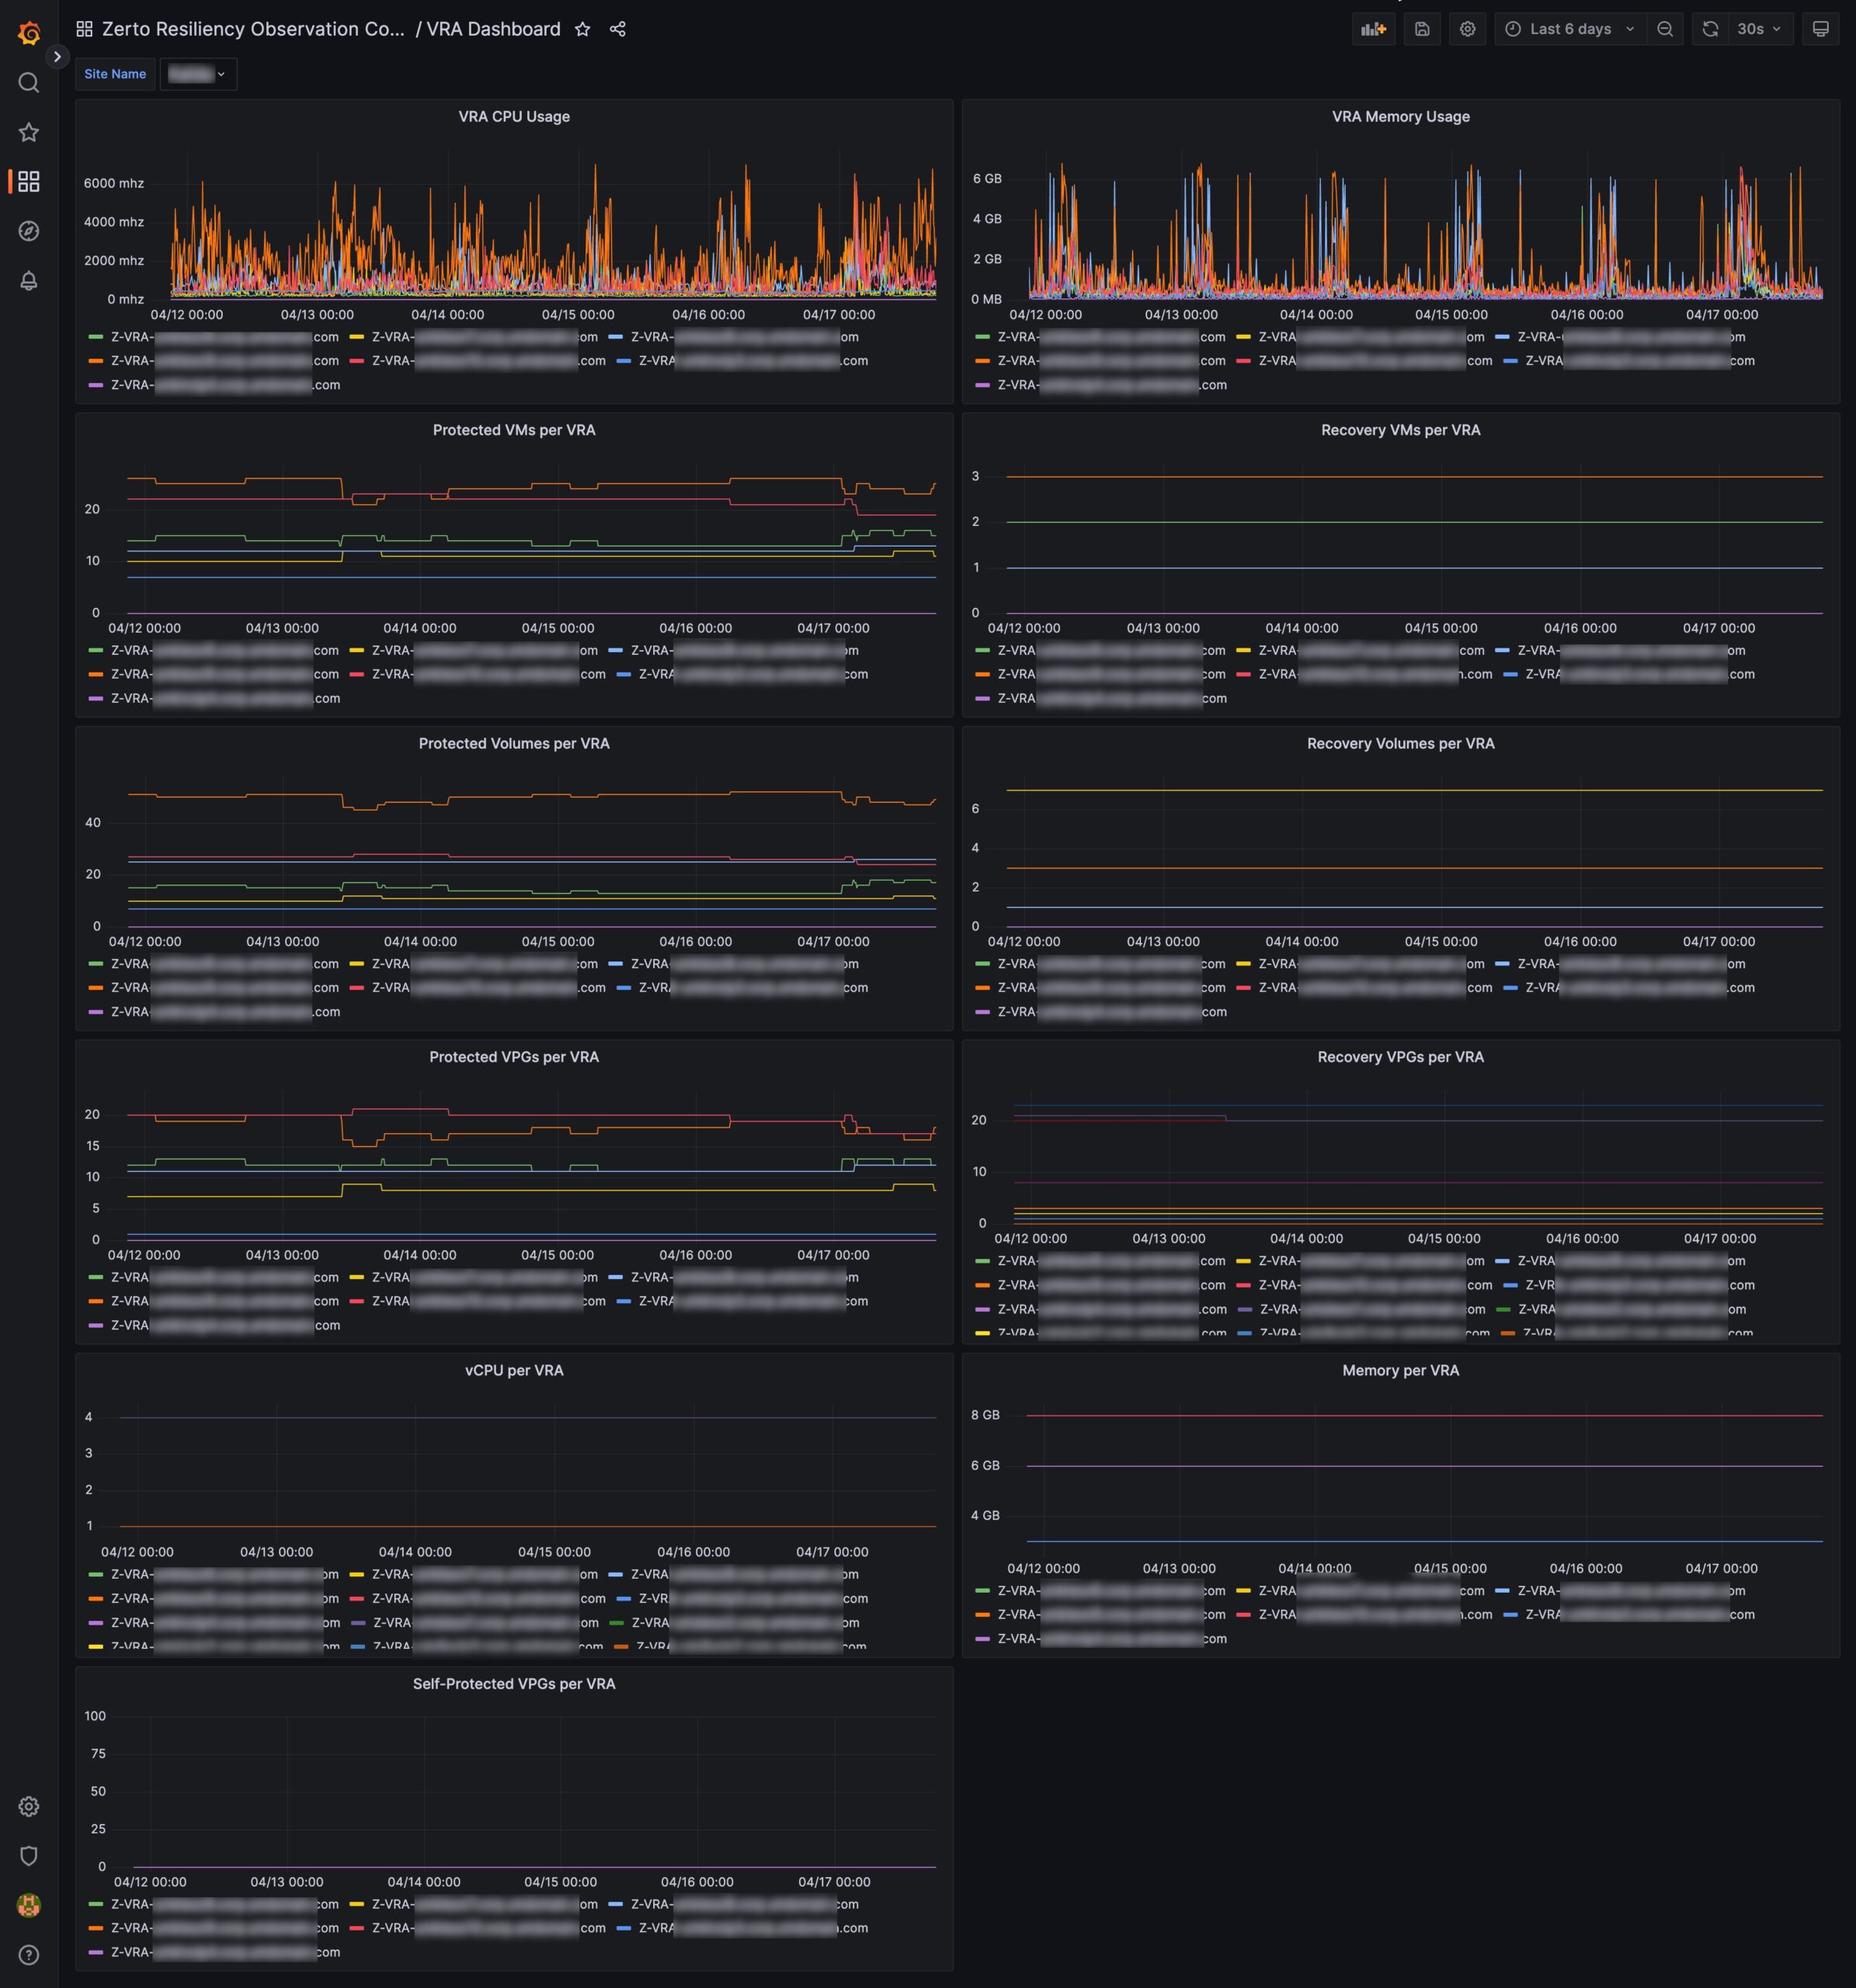
Next is the VRA dashboard, showing VRA CPU/Memory Usage, as well as the number of protected and Recovery VMs associated with each VRA
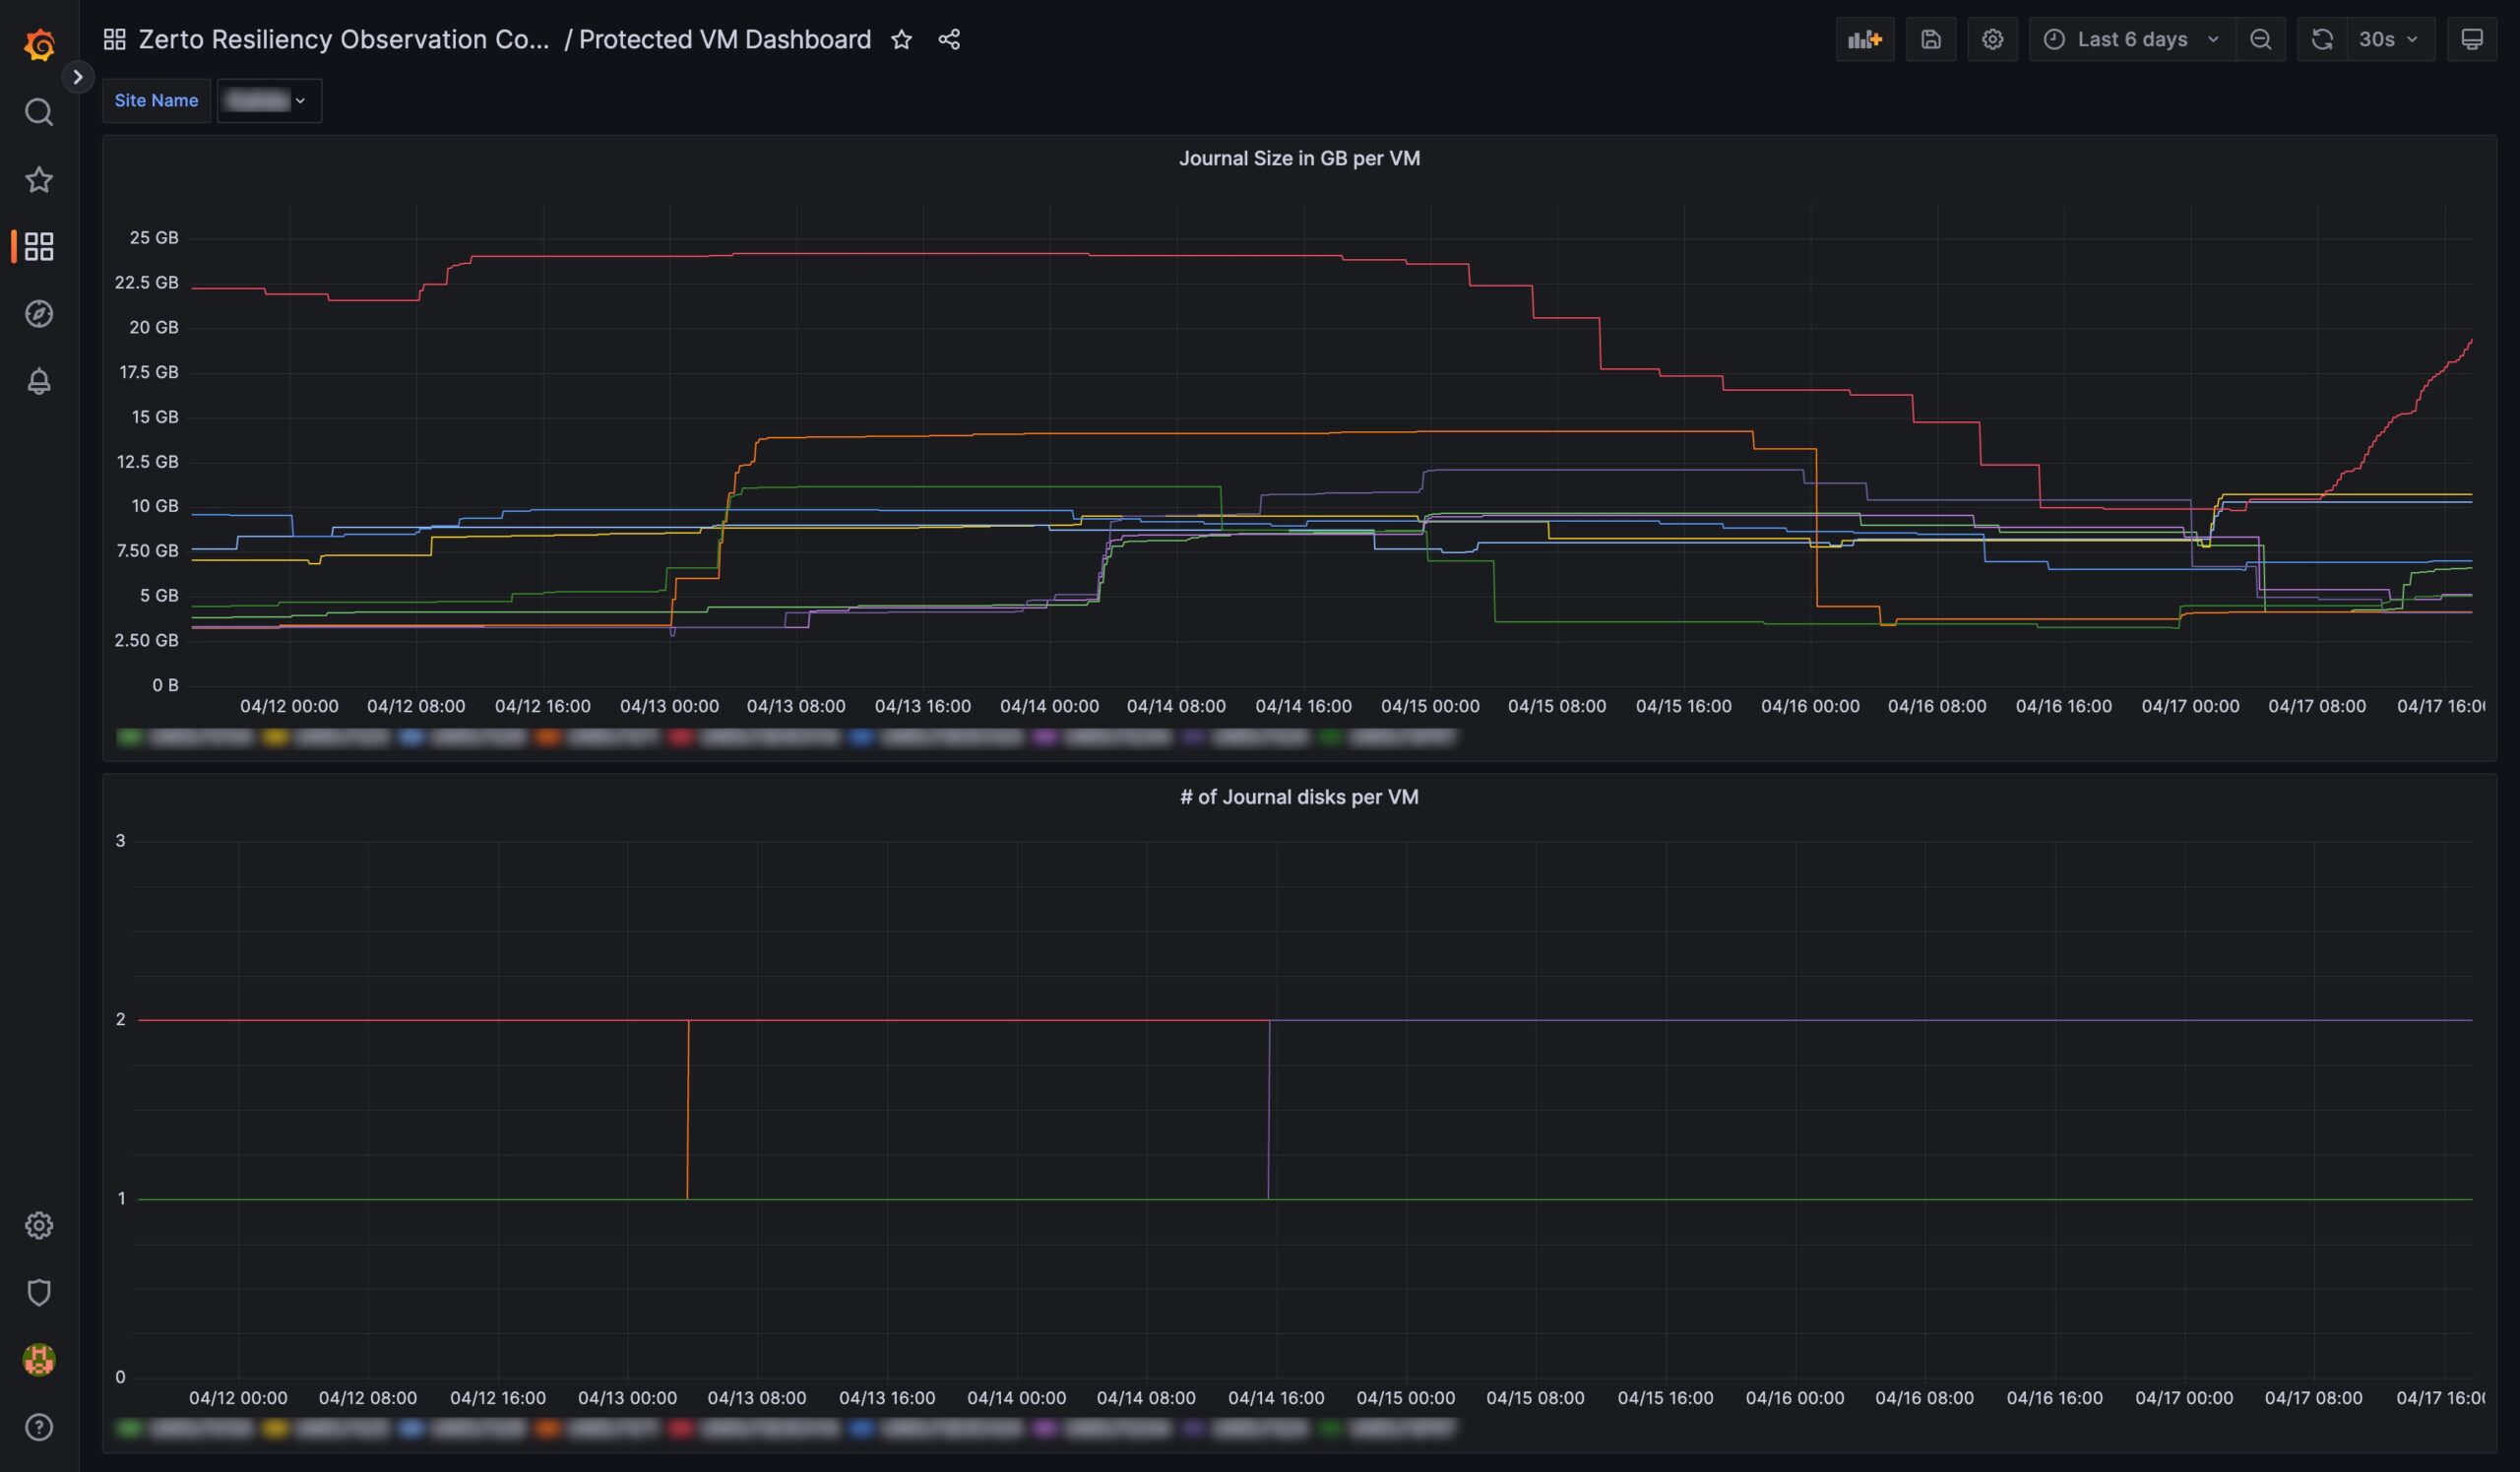
This smaller dashboard, shows per VM metrics for Journal Size, and Number of Journal Disks per VM
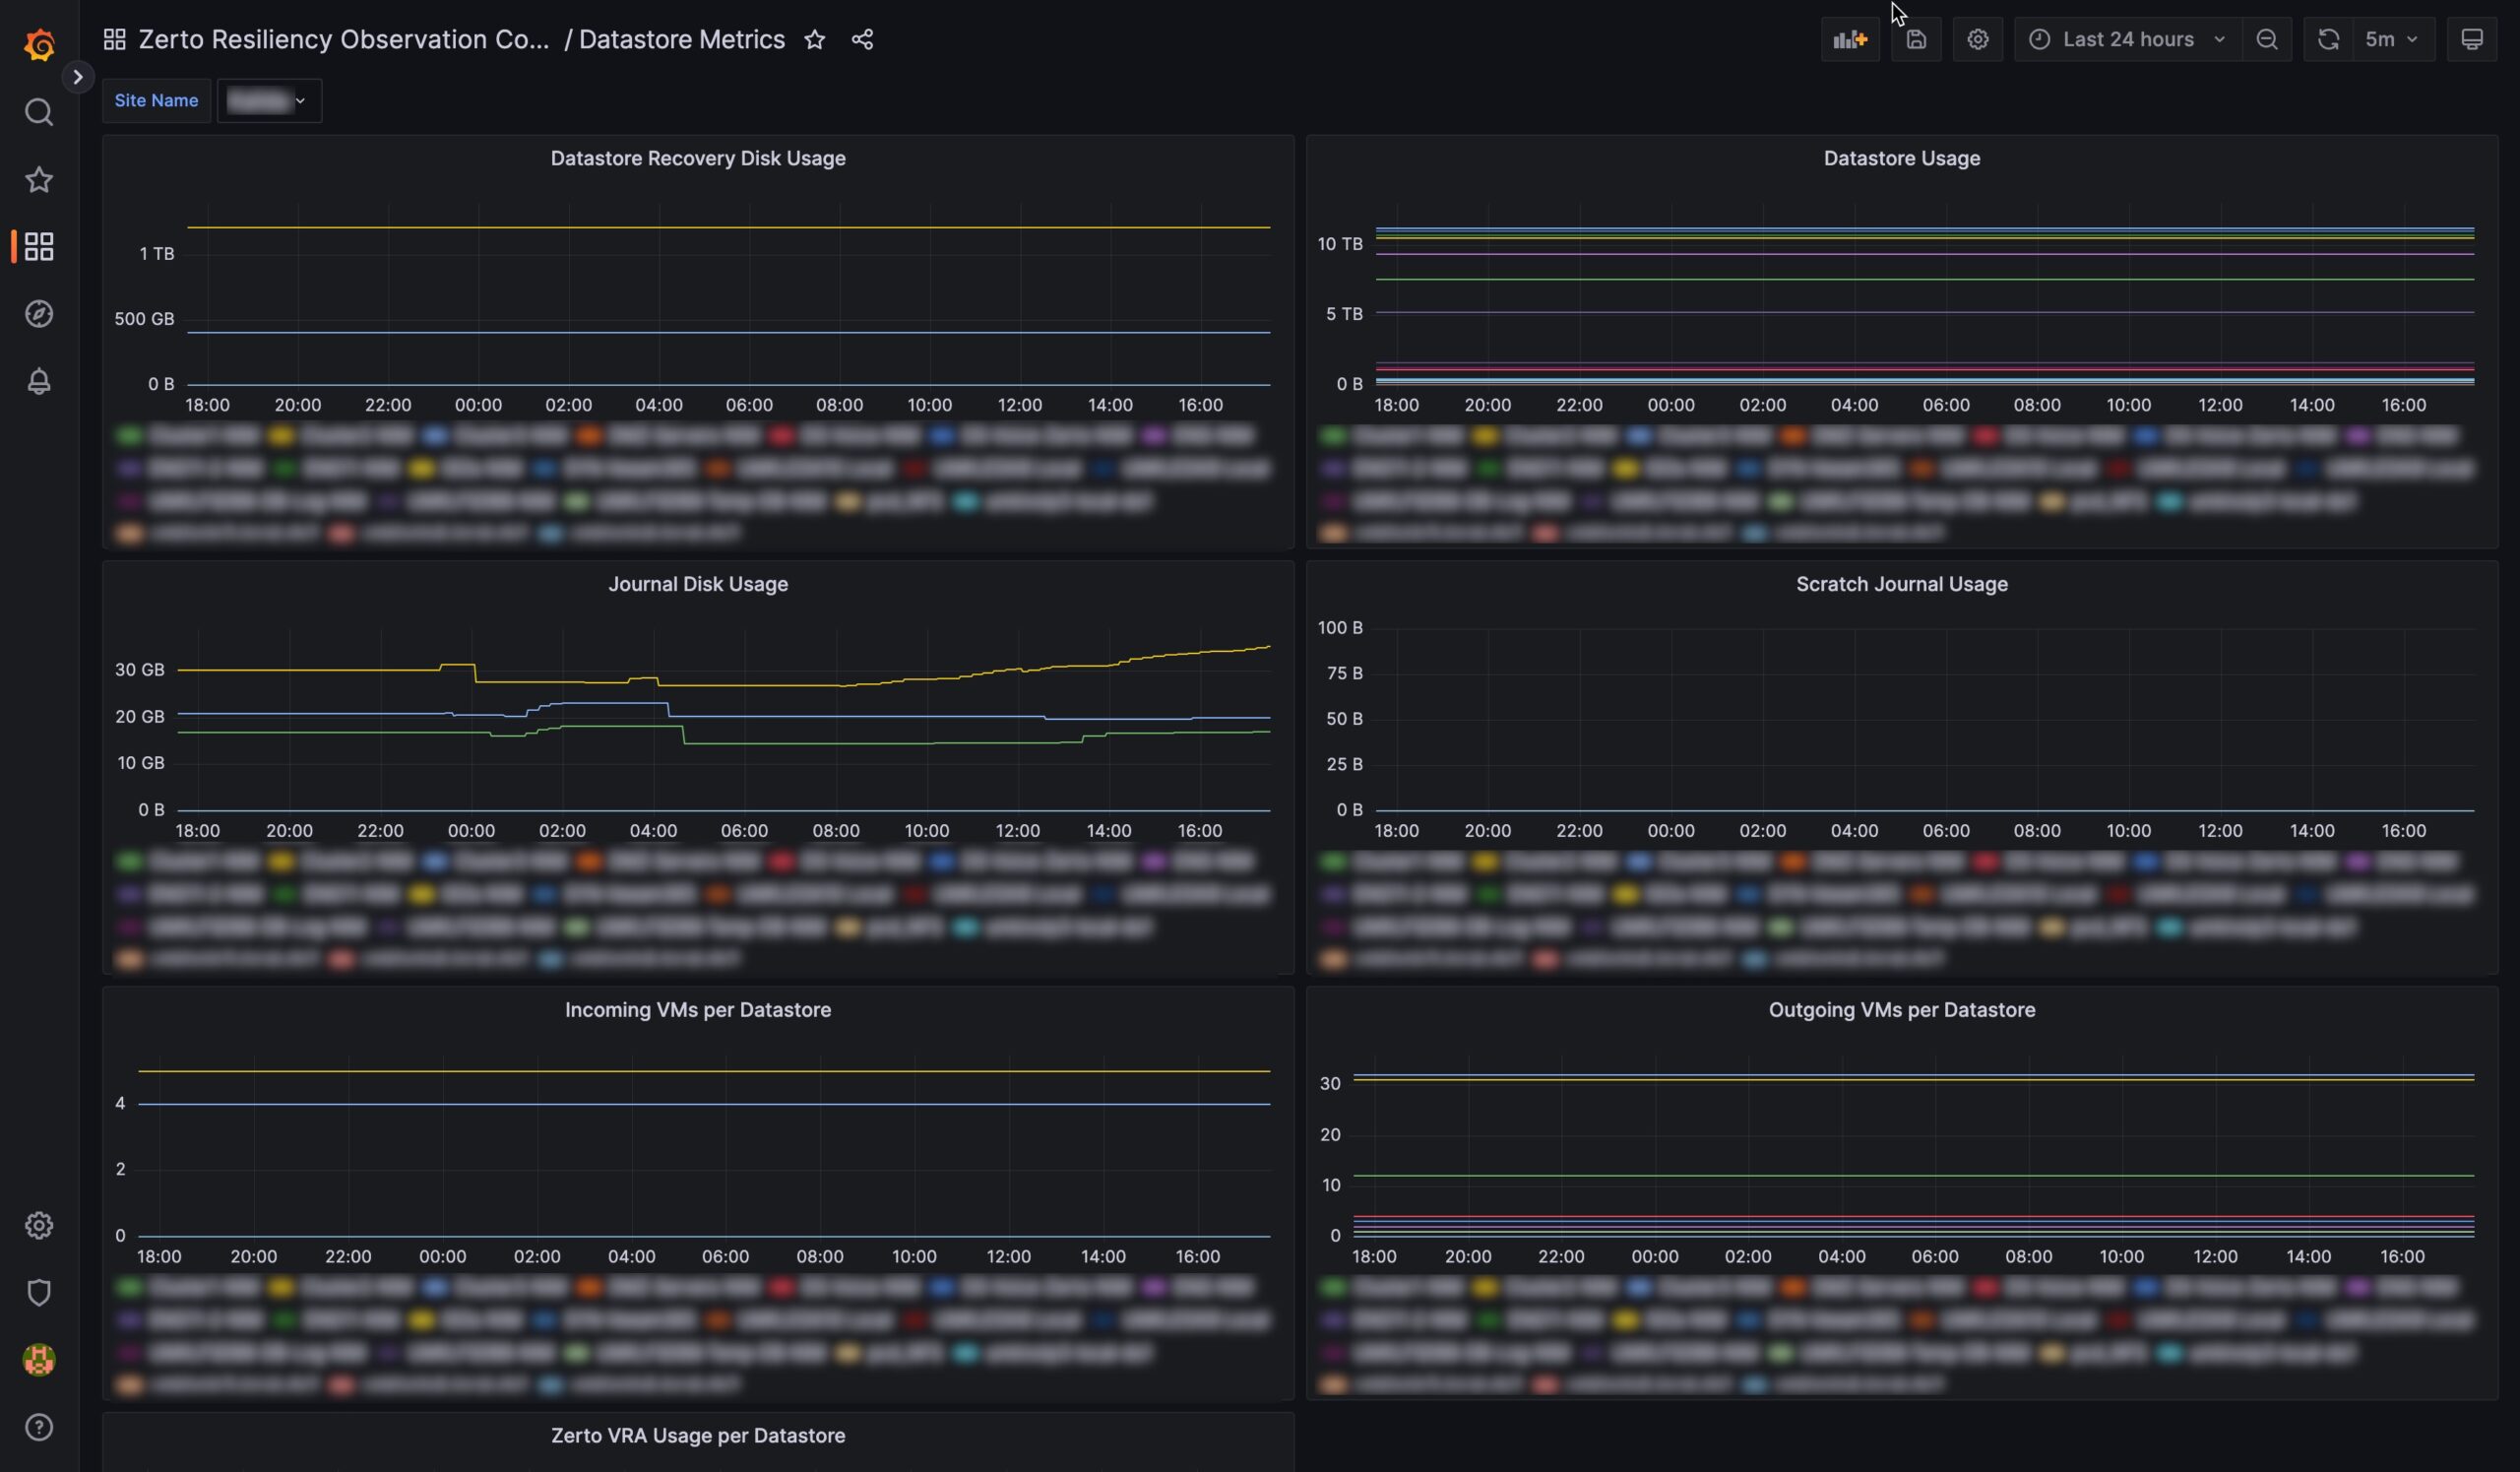
Datastore metrics – showing how much storage Zerto is using on each dashboard.
![]()