What is zPlanner?
Project goals
As more and more companies make the decision to explore public cloud it has become very important to be able to gather statistical data from those workloads and analyze it for things like change rate, IOps, disk size, as well as vCPU and vRAM sizes. All of those things contribute to whether a virtual machine is a good candidate for public cloud, and my goal is for zPlanner to make getting that data as well as analyzing it as easy as possible.
Project requirements
When I started building zPlanner my goal wasn’t to replace full-featured monitoring solutions. If you need one of those check out Turbonomic! They are also a site sponsor!
I just needed a solution that met these requirements:
- Monitor storage statistics from virtual machines (VMware to start, HyperV later)
- Gather vCPU and vRAM and Disk Capacity
- Produce custom graphs and reports
- Be free to use in a commercial (pre-sales) setting
My search returned nothing that met all of those requirements, so D.I.Y. to the rescue.
What’s under the hood
zPlanner uses a combination of open source software and custom scripts. It is meant to be deployed by a Zerto SE (and hopefully at some point by our partner SEs) at the customer site. To make this as easy as possible I have all of the components packaged into an OVA file so that it can be easily imported right from the vSphere client. Let’s review those components.
[stextbox id=’info’]I have published a second, more geeky article on the zPlanner Scripts here. So finishing reading this article for the high-level stuff, then head over there for the geek version.[/stextbox]
Components
- Operating System – Ubuntu Server 16.04 LTS
- Database Server – MySQL
- Database Management – phpMyAdmin
- Backend: Microsoft PowerShell for Linux (with VMware PowerCLI), PHP 7.0, BASH
- Frontend: Grafana
All of this is packaged as a VMware OVA compatible file that comes in right at 2GB in size. Once deployed it requires 2vCPU and 2GB of RAM, but when monitoring more than 300 VMs I recommend bumping the appliance to 4GB of RAM, and when going above 500 monitored VMs it is advisable to also bump the vCPU count to 4. PowerCLI is a very inefficient way to get that VM stats… but it would seem as though there are no better ways available at the moment that are easy to implement.
Deployment and configuration
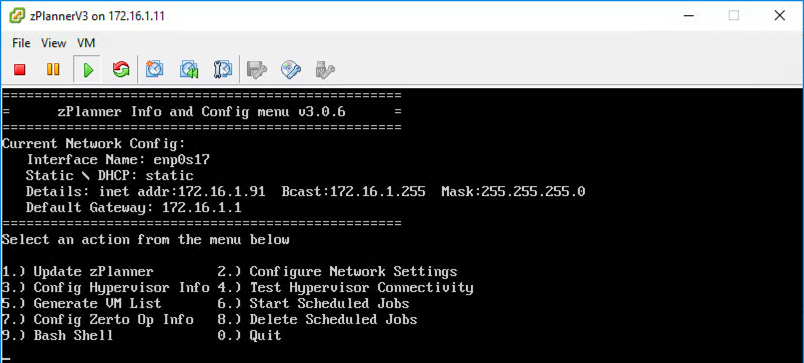
Deploying the zPlanner appliance is the same as any other OVA file. It’s very straightforward. After deployment and power on you will see the custom BASH based dashboard menu. From here we can do pretty much everything needed for deployment.

I tried to order the menu items in the same order in which you would want to run them during deployment. If you are OK with DHCP, then the first thing you want to do is run “Update zPlanner” after deployment. If you need to configure a static IP address then you will want to run option 2 before doing the update step.
1. Update zPlanner
This step will call up GitHub and grab the latest zPlanner scripts from my repository. This makes it super easy for me to develop new code and optimize existing code without the need to create a new OVA file each time.
2. Configure Network Settings
This step is only required if you need to set a static IP address. In version 1 and version 2 of zPlanner, you had to manually go in and configure the Ubuntu interfaces file if you wanted a static IP address. This proved to be pretty difficult for folks who didn’t have experience with Linux. So I looked around and found a really awesome BASH script that is able to take some user inputs and configure the interfaces file for you to be static or DHCP.
3. Config Hypervisor
After getting your appliance on the network and updated the next step is to configure it for your vCenter environment. So this step will ask you for your vCenter IP address as well as username and password. It then encrypts your password and stores it that way so that if someone were to break into your zPlanner they cant grab your vCenter password.
[stextbox id=’info’]zPlanner only uses “Get” PowerCLI commands, and therefore it is perfectly acceptable (and advised) to only use a read-only account when configuring the appliance.[/stextbox]
4. Test Hypervisor Connectivity
This step simply tests the credentials that you entered. If they don’t work you can go back and run the Config Hypervisor again.
5. Generate VM List
This is the first step where we actually go get data from vCenter. This process goes to vCenter and runs the “Get-VM” PowerCLI command and stores the VM Name, vCPU count, and vRAM size in MySQL.
After generating the VM list the next step in the process is to go into the (really basic) web interface and select which VMs will be monitored by zPlanner. For Zerto’s purposes, we only care about which VMs that you will want to replicate with our product.
6. Start Scheduled Jobs
After selecting all of the VMs you want zPlanner to monitor, the next step is to enable the cronjobs that trigger the PowerCLI scripts to run. This step basically tells the zPlanner to schedule the “Generate VM List” step to run once per day, as well as a script I call “vm-getio.ps1”, it schedules this to run every 5 minutes. But the vm-getio.ps1 script actually has some intelligence built in. It detects how long it took to run the last stats gathering process. If it takes longer than 5 minutes, it will adjust the cronjob accordingly so that zPlanner doesn’t push vCenter too hard.
7. Configure Zerto Op Info
This step is purely cosmetic. It puts information about the customer and the Zerto sales team into the database. It might not seem important, but when you have a bunch of SQL files to analyze, having the customer and Zerto team information right in the database so you don’t get confused is pretty nice.
8. Delete Scheduled Jobs
Once you are done with zPlanner you can stop the cronjobs. This is useful in case you want to keep the database and Grafana sites online but no longer gather new data
9. Bash Shell
The dashboard menu runs automatically on the zPlanner console as well as whenever you login via SSH… using this option allows you to drop down to a BaSH shell and run other commands on the appliance if needed. (custom routes, etc)
0. Quit
If you are ssh’d into the dashboard this option will kick you out of your session. If you are on the console it will restart the dashboard.
To say the least, I have quite a bit of time in the scripts that pulls zPlanner together. The scripts that go out and get the data from vCenter were (mostly) derived from existing scripts on the internet.
What’s collected
Probably the easiest way to explain what is collected is to crack open the database tables and take a peak. I should note that version 3 is certainly not going to be the last version (assuming the tool is still needed and I have time to develop it… more on this at the end of the article). These screenshots represent the current database schema which is subject to change.
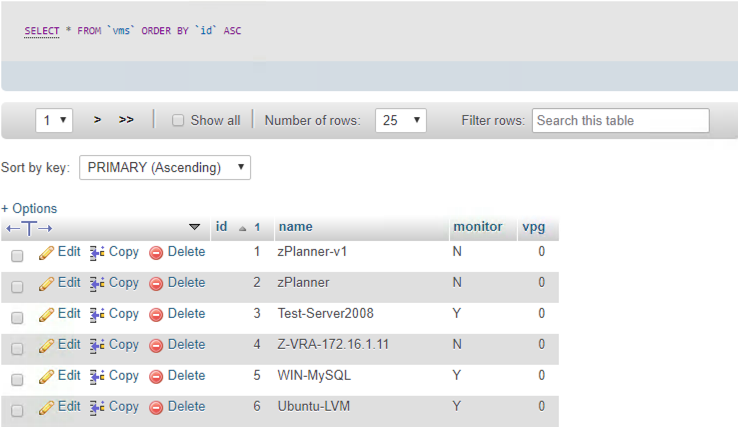
VMS table
The vms table holds the list of virtual machines in the vCenter inventory. as you can see in the screenshot below I only store the VM Name as well as if it should be monitored or not. The vpg column is reserved for future use and may be used to define which VMs belong in which Zerto Virtual Protection Group.
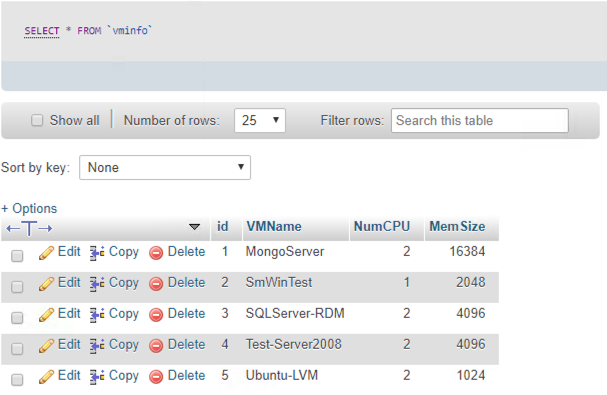
vminfo table
This table somewhat overlaps with the vms table, but in the future, I may consolidate this table into the vms table. For now, though, it holds the vCPU count, the vRAM size, as well as the VM name…. yes I know i should really just reference the unique ID number from the vms table to shrink database size.
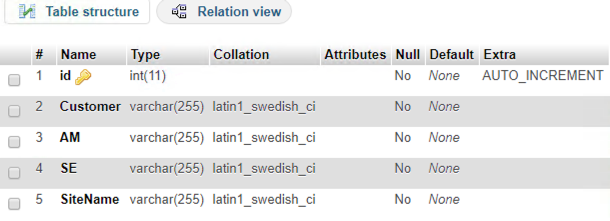
accountinfo table
This is the table that holds the zerto account information.
stats table
So here is the meat of zPlanner. this is the table that gets updated every time the stats collection takes place.
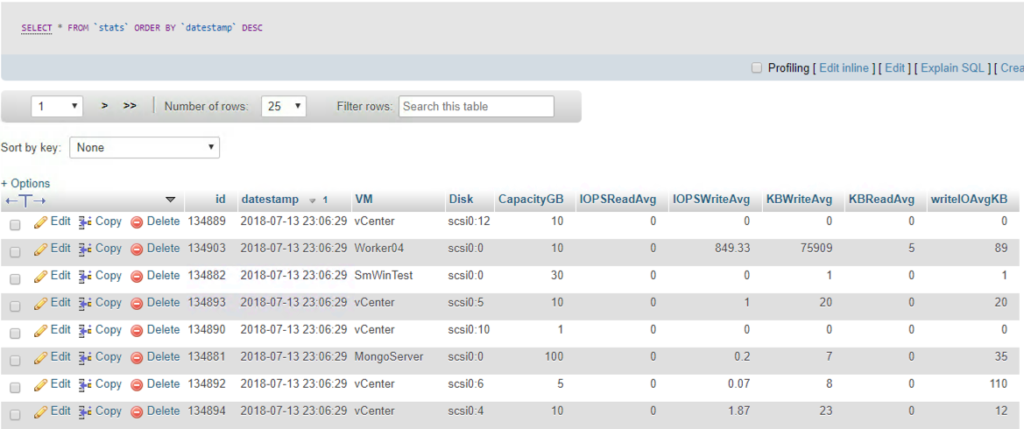
Because the data in this table is loaded from the Get-stats PowerCLI command, it gets a little more info than what is needed for Zerto replication sizing. However, I figured there was no reason to through that data away since we want to make sure that the public cloud will be OK with the VM. (Remember that public cloud puts a limit on the number of IOps you can generate on certain storage offerings… so it’s good to know read IOPS and throughput as well as write.
Is the data gathered confidential?
It depends. Mainly because lawyers are picky, and each of them may consider different things confidential. So all I will say is that everything zPlanner collects are just numbers, the only exception is the VM name.
Also keep in mind that zPlanner uses a read-only user account for vCenter access, and the credentials are never stored in the database, and never leave the zPlanner.
Lastly, the MySQL database doesn’t have to leave the customer site. It does make our lives a lot easier if we can dump the collected data to an SQL file and then load it into a zPlanner we have running locally (instead of at the customer site), but that is just for convenience and because the zPlanner does not call home in any way. So without a SQL dump, the only way for the Zerto team to look at the data is to do a screen sharing session. (I thought about enabling OpenVPN and using a special jump server to allow access to the zPlanner web interface, but that functionality hasn’t been implemented due to foreseen security concerns)
How is the data displayed
From the screenshots above you are probably thinking that the only people who could get any details out of that data are the true nerds. So, instead of looking for one of those, I added Grafana to the appliance. If you haven’t work with Grafana I would highly recommend it.
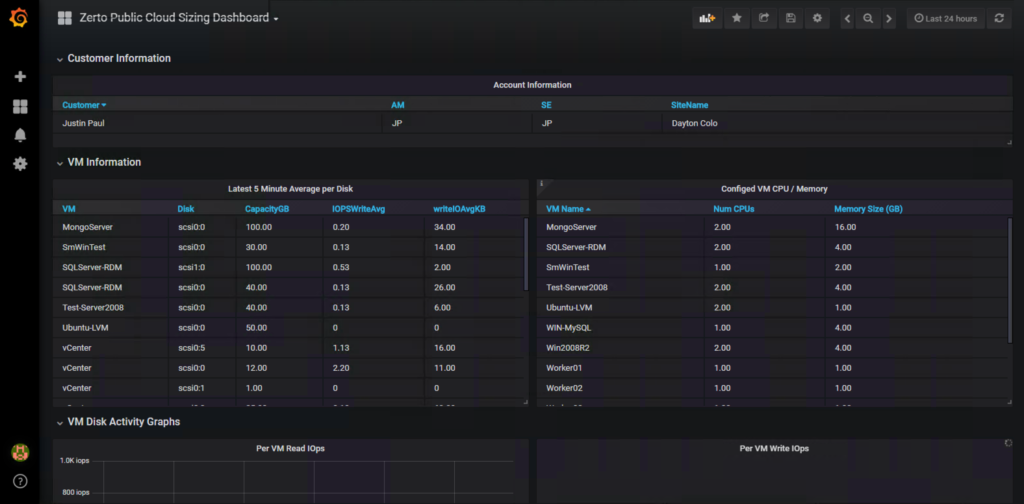
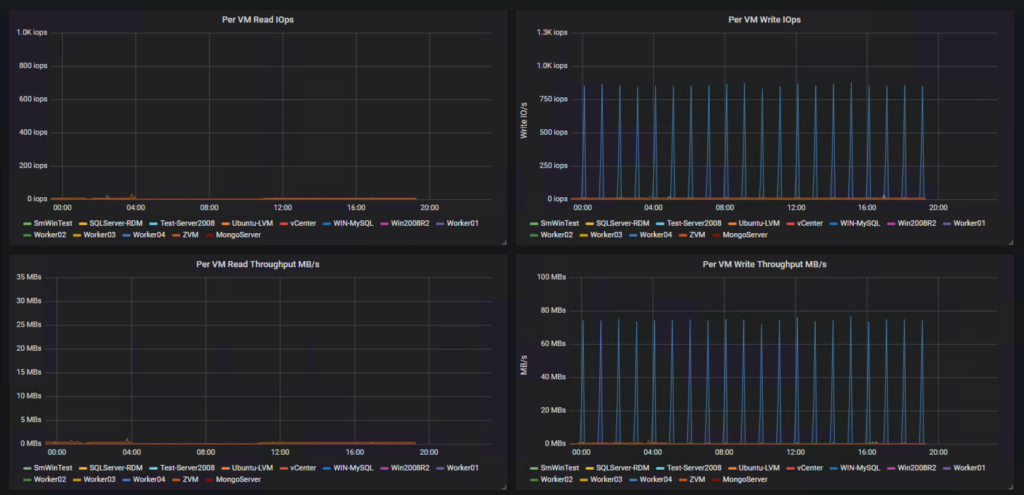
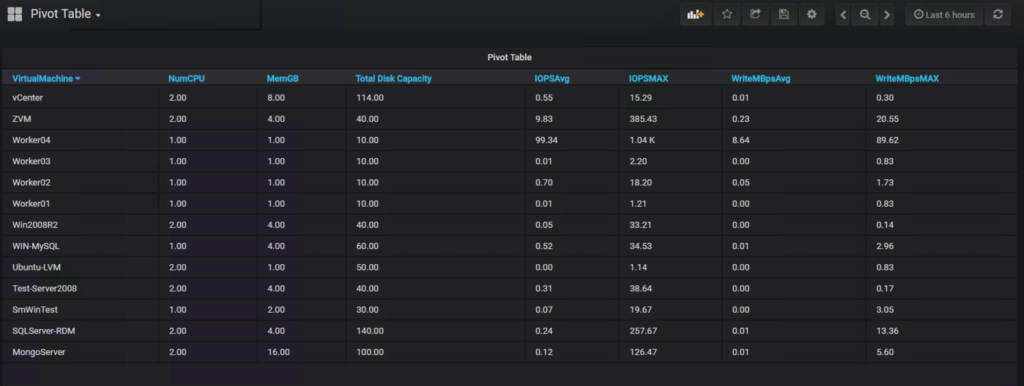
Inside of Grafana, I can build graphs, tables, and all sorts of pretty GUI type stuff.
Basic VM info
Per VM stats
Pivot Table with data from multiple database tables
Exporting Dashboards
Before I move on, I want to mention that all of the dashboards that are in the screenshots above are exportable in JSON format. This means that as I develop new dashboards I can export them, and customers can then import them into their zPlanner and get a whole new view of the data. SUPER COOL!
The Future of zPlanner
So I started this project with the hope of making it very easy to see how much WAN bandwidth and how many Zerto Cloud Appliances would be needed for a given workload. But as I’ve gotten feedback from the people I work with I think it could be much more. As you seen earlier I have already added in some database things to prepare for VPG information. Maybe sometime in the future, it could be possible to design your VPG layout in zPlanner? Then, with the click a button, tell Zerto to create the VPG; technically it is possible.
I also will post a few more articles on how the back end scripts work as soon as I get more time. If you are a geek it’s pretty cool how it works.
Roadmap Ideas
Just a list of possible ideas for future updates:
- Public cloud instance size to on-prem instance size matching
- Public cloud price comparisons (how much will this Vm cost in Azure / AWS)
- Warnings or a list of VMs that cannot move to public cloud and the reason why
- Probably a lot more to come as I continue to build the project.
Want to contribute?
If you know PowerShell / PowerCLI, BASH, PHP, MySQL I invite you to take a look at the code of this project. It is all available on my GitHub repository here. If you find something I could do better submit a pull request and I’ll take a look.
If you would like the OVA file, I ask that you use the Drift Chat plugin in the lower right corner to drop me a note.
If you want to be kept updated on zPlanner announcements add yourself to the mailing list with the form below.
[mautic type=”form” id=”14″]
![]()


Pingback: Why Innovation, Risk, and Curves make for the best careers | Justin's IT Blog
Pingback: 10 In-demand skills to learn in 2019 | Justin's IT Blog