One thing that the standard HP P2000 web interface does not touch at all is performance stats. In fact one of my biggest complaints about the box is that there was really no way to see any stats on the box unless you logged in to the console (or through ssh) and ran some commands. However the other day when I was looking around for some firmware updates for the box I’m using I found a link for a “HP P2000 Performance Tool”. Naturally I forgot all about the firmware updates that I was looking for and quickly downloaded the tool.
Here is the official description:
“This Windows Smart Component installs HP P2000 MSA Performance tool on a Windows system. HP P2000 MSA Performance Tool simplifies the monitoring of performance across multiple HP P2000 G3 MSA arrays. After discovering arrays in either the local subnet or specified IP address range, you can use the Performance Tool to do the following: Obtain a snapshot (sample) of current configuration information and statistics for a specific array, Collect performance data in specified, regular intervals for an array. Data is collected for array host ports, controllers, vdisks, volumes, and drives. Using the collection of data, you can graph the performance data against different metrics, such as I/O per second and CPU load. Information collected for each array is stored in comma-separated values (CSV) files, for easy export and use with third-party tools. ”
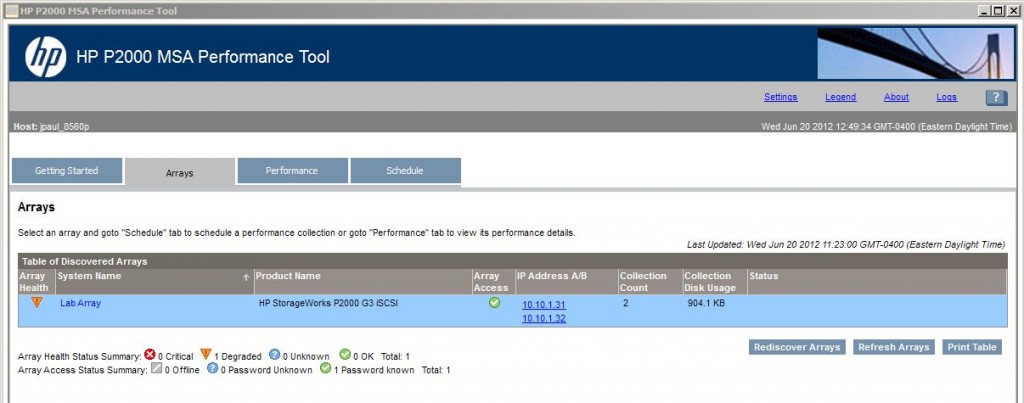
Using the tool was very easy, after a quick simple install you tell it how to discover your array and it adds it to a list:
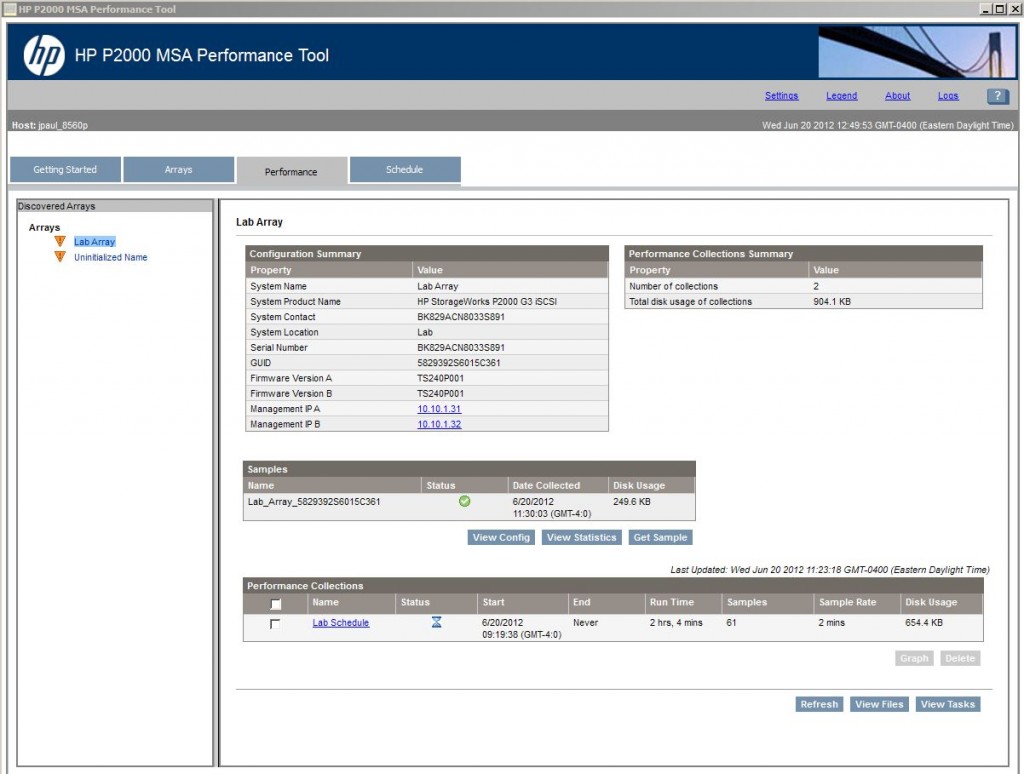
After adding the array to the list you can switch over to the performance tab and see what I would consider the “main” interface. This tab allows you to select the array on the left that you want to grab the stats for, and then on the right you can select “Grab now” or look at the stats that have been gathered over time.
It should be noted that this is not a tool that will put together a pretty grab of the stats over time. This is simply a point in time snapshot of what the box is doing displayed in a table format. But seeing as this is a 1.0 product my guess is that the pretty stuff will follow in later version. Also seen in the previous screenshot is a schedule tab, where you can schedule the stats gathering to happen at a given interval.
Here is the link directly to the tool.
![]()


Dude, do you happen to have the HP MSA Discovery Tool for download, because linking to stuff does not work as you can see that your link is already broken, since HP keeps moving things or even removing them as they go into Legacy support. It would be better if you actually hosted the Installer executable for those of us who find you via Google, but I do not need the Performance Tool and rather the Discovery Tool.
I used to have it, upgraded to Windows 8, and forgot to keep a backup so now it is impossible to find and Google is just leading me to MORE people, such as yourself who reference stuff but do not host the executable. Just figured I’d ask since you might have a backup copy, thanks…
I have exactly the same problem.
Good to see it exists in screenshots, I was starting to doubt it actually did.
I’ve been searching HP and Google for the last hour or two and just can’t find this tool anywhere.
An upload of it or new link or anything would be great.
Yeah me to guys. All link broken.
This article is almost 3 years old. HP has changed their site since it was posted. I would search Hp.com for the tool name.