From time to time I get asked how to turn on the statistics logging functions on a VNX array so that a customer can see what is going on inside of the box. To go along with that same request I have also included the instructions on how to pull those stats from the array so you can send them to your EMC team or partner.
Turning stats logging on
- After Logging into the array click on the systems serial number in the upper left hand area of Unisphere.
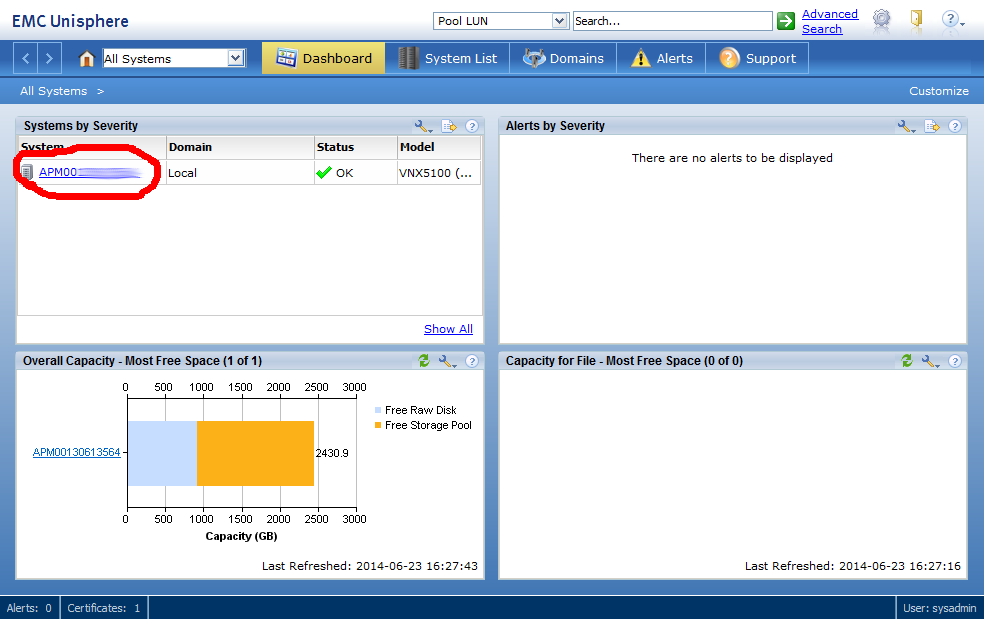
- Next click on the “System” button in the upper ribbon.

- On the System menu select “Monitoring and Alerts”

- On the Monitoring and Alerts menu select “Statistics”
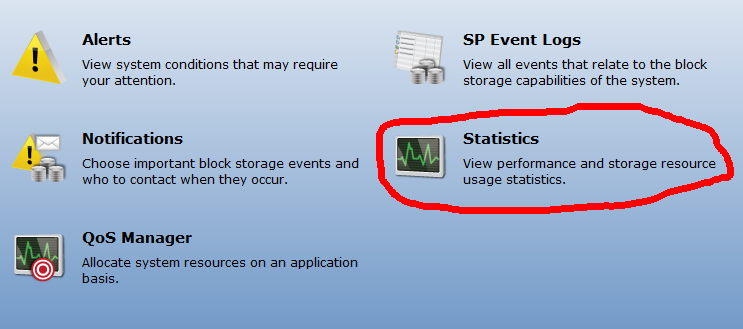
- Finally in the Settings area on the Statistics page select “Performance Data Logging”. It is the top option on the left side.

- A box will popup with several options on it. You will want to make sure that “Periodic Archiving” is checked, and check the box next to “Stop Automatically After” (and normally I leave this at 7 days, but adjust as needed). Finally make sure to click “Start” before closing this box.
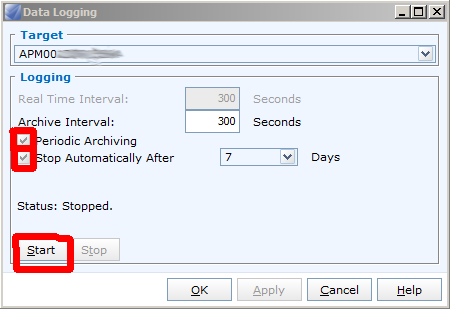
- After starting stats just sit back and wait for the time period you selected to go by, after it has passed you can return to the SAN and retrieve the stats archives and send them to your EMC partner or EMC SE as needed.
Retrieving stats archives
To collect the stats from the array follow steps 1 – 4 from the previous section, then proceed with the following steps:
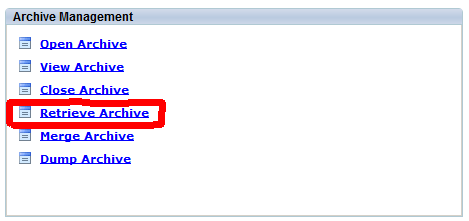
- Once you are on the Statistics page, click on “Retrieve Archive” from the Archive Management panel. (4th option down on the right side)
- A box will pop up that looks much like a basic file manager. In the “Archives on SP” box you will find the archives of that stats. You can select all of the relevant archive files which will end in .NAR or .NAZ. then select a Save As location. And finally click Retrieve. Make sure to also switch over to SPB and collect the NAR/NAZ’s from that storage processor too!
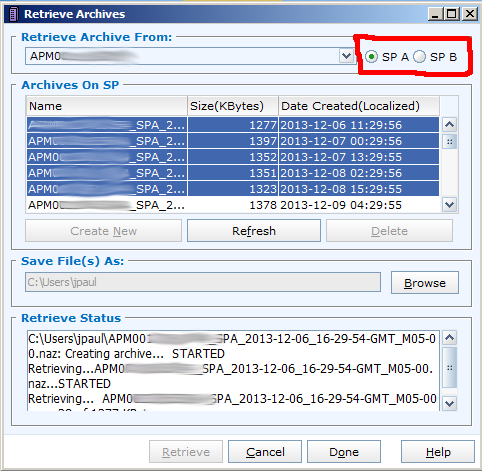
- After clicking retrieve the stats archives will download to your local PC. From here you can select “Done” on the Retrieve Archives box and then create a ZIP file from all of the NAR/NAZ files. They are now ready to go to your EMC Partner or SE Team.
The only other thing required to generate the pretty graphs and heat maps is an SP Collect from one of the SP’s in the system. Typically EMC will have you upload all of this data to their FTP server (they will provide an account). Or if you are working with me I will either webex in and upload the files directly from your machine, or have you send them to my FTP server.
![]()



Hi there,
additionally to this, EMC offers a end user/customer login option to Mitrend from now on.
emc.mitrend.com is the page to go.
From there you can upload your NARs and SP Collect file and get a report generated with every necessary information in powerpoint sheets. Pretty nice and useful for a lot of other stuff as well.
Greetings
Phoenix
If you running the “VNX Monitoring and Reporting” server you also need this option activated.
Great point Dominik. I believe that if you are using anything with the SMI-S plugin (i know VMTurbo also requires that) then i think (not 100% sure though) that you have to have stats enabled …. without the “stop after” x days option though
We’re doing this exactly this way. When you disable these options you did not get any data into VNX Monitoring and Reporting.
That´s not correct. For monitoring&reporting you only need to activate the statistics logging option found in the system properties tab. Unisphere – System – (right hand side) Properties
The Analyzer process should never ever be set to run endlessly. Sooner or later you will fill up the system drives and you have an impact on the performance. M&R scans the system with naviseccli commands and does not need the performance monitoring for this.
Feel free to test it. 🙂
Here is the picture where you can see the option:
http://www.sentrysoftware.net/library/senemcx/enablingstatisticslogging_unisphere3.png
I believe you. And thank for fact checking me. I havent fully setup the VMturbo interface to work with an EMC so i was just assuming 🙂
Also thanks again for reading! (and helping out :))
You´re welcome.
You just have to know, that the VNX does not send any performance data via SNMP. The Analyzer is usually used for troubleshooting and performance analysis and can really impact the performance of a system if you change the logging period and interval level.
Statistics logging is the foundation of everything on the system and should be set active all the time (it get´s disabled during updates but that doesn´t matter actually).
If you forget to set it active and start VNX monitoring and reporting you will only see the hardware information of the VNX but no stats at all but it will work.
The title threw me off a bit. I thought it was going to be enableing logging on a SAN switch or something, but then again, the word “VNX” suggested a commonly made mistake where a storage array is called a SAN. You don’t call your file server the LAN either, do you?
Anyway, I like this post a lot. It shows how to enable analyzer logging on a VNX and how to retrieve that data from it afterwards.
SAN logging is actually quite expensive. I know that you can do it with watch4net for example or use the customer branded tools like Brocade Network Advisor but most of these software frameworks demand a license. There is a free to test trial for the brocade tool but you can only manage and monitor one fabric (as far as I know) and that only for 60 days or so.
There might be some sort of nagios plugins available for that task bur haven´t checked on these yet. I work with brocade fabrics most of the time and if I need a point in time view of SAN performance on the ports I use Brocade SAN Health what is actually free to use but is limited in its possibilities and use an excel table output for the port statistics and therefore is not that good to use to actually analyze glitches. You get a nice overview of the port statistics and automatically highlighted any specs you might need to investigate further. Don´t forget to clear the stats before you do an analyze of course so you don´t get any old issues showing up that were already solved. 🙂
Phoenix is correct! Thanks for your help!