Agriculture has been part of my life forever. I grew up on a farm and worked for my grandpa and dad until I was old enough to go off to university. Computers were a huge interest as well and sometimes those two priorities conflicted when I was growing up. I cannot even count the times I got told to get off the computer and get outside because <insert labor intensive task here> needed done.
Fast forward about 20 years and it was time to step up and purchase one of the family farms from an aging family member. So, I guess I’m a farmer again, but I’m also still a geek.
The downside of being a part time farmer is that most of the fancy equipment is simply too damn expensive for what the pro’s would call a hobby farmer. I plant 25 acres of corn per year, and dad plants about 30, even combined we are still very small farmers in the big picture.
Most precision agriculture practices are out of reach for most small farms. A new planter which has built in monitoring can be $100,000+ dollars from a compnay like John Deere. John Deere also isnt going to sell their technology separately so I can retrofit our 40 year old planter, and from what I’ve seen the 3rd party retrofit options are usually several thousand dollars too!
The geek (or paybe the product manager) in me asks why, why are these so expensive? Am I missing something?
IoT style electronics are everywhere. They cost nearly nothing. So, why aren’t there affordable technology tools for small farms?
I guess in the meantime I will just have to build something myself.
Why does it matter
Research gate has a nice graph that explains this. Simply put, there is a point where you are throwing money away.
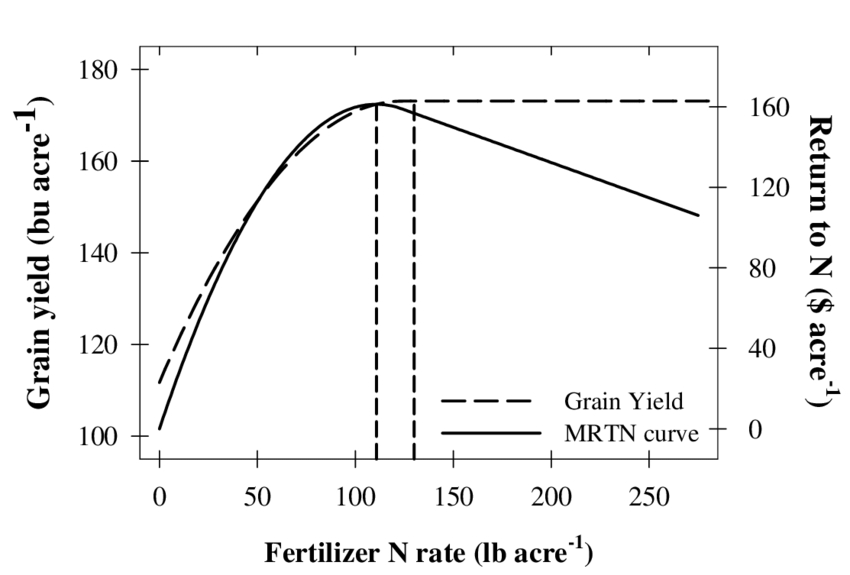
Corn can only use so much nitrogen. Adding extra nitrogen may benefit a future crop, or weeds, or add to runoff… but the main reason farmers care is $$$. While mine is a small “hobby farm”, it’s still a business which needs to be profitable.
The cost of nitrogen is the highest input cost per arce for a field of corn, so hitting that sweet spot is the only way to maximum profitability.
The easiest way to know if your hitting that sweet spot is to monitor how much fetilizer (nitrogen) is going in the ground.
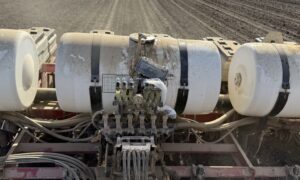
Liquid fertilizer application monitor
Liquid fertilizer is the backbone of a successful corn (maize) crop. It’s so important that if part of a field doesn’t get the right amount you can easily tell the corn is usually a little shorter and not nearly as deep green in color. Monitoring fertilizer during planting (at least on our planter) is done via 6 sight gauges where a little red ball bounces around due to fluid flow. If the ball sinks to the bottom while you are moving down the field you have a problem.
But … how many gallons are actually going to each row? How much flow does it take to get the ball to move? All questions that I can’t answer.
But this thing can:
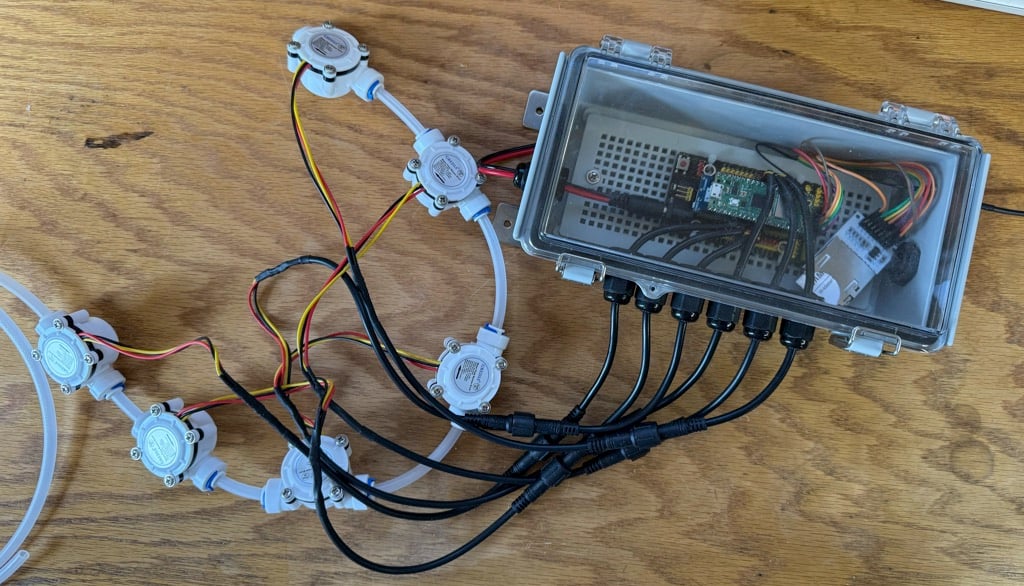
This is my prototype flow rate monitor for liquid fertilizer (called ’28’ in the business).
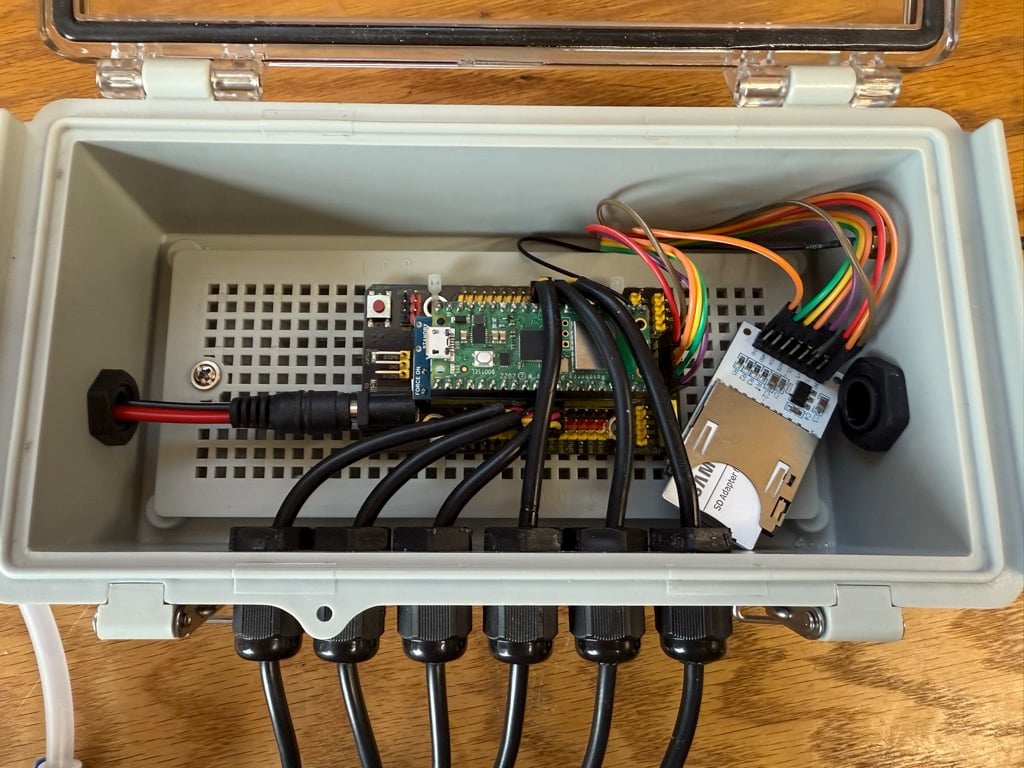
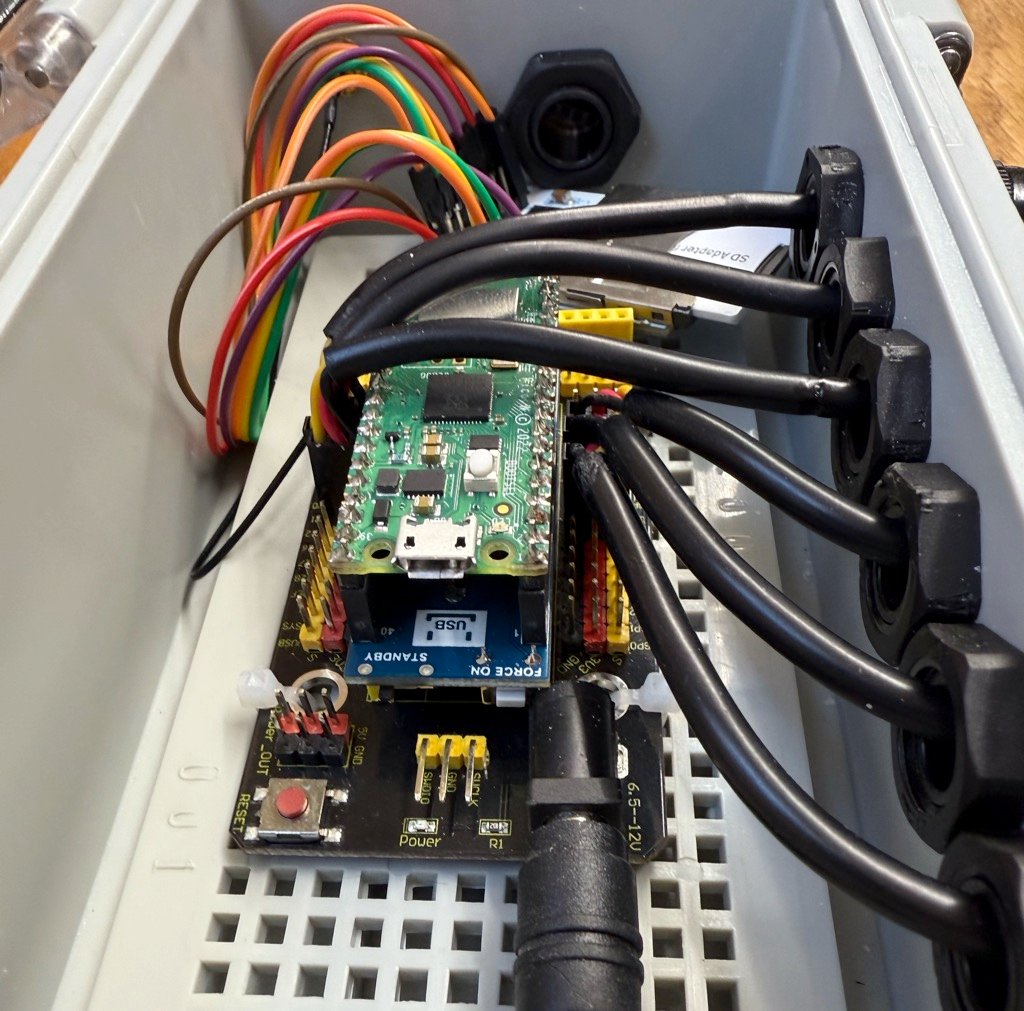
It combines some typical project box components with a Raspberry Pi Pico and a GPS module. There is a detailed parts list below.
How It works
This is Part 1 of the project. There will be at least 1 more part, because right now it isn’t installed on the planter. After I get real performance data this spring I will do a Part 2 with findings on what worked, what didn’t, and how I will improve the project.
Here is how it works right now.
Each row on the planter has a 1/4″ liquid fertilizer line that runs from a central pump. I will install one of the hall effect flow meters in-line for each row. The sensors will report pulses to the Raspberry P Pico which will keep track of each row separately.
The Pico also will advertise a Wifi Access Point (because I havent fully figured out Bluetooth yet). I will use my phone to connect to the wifi access point and access a webpage that the Pico is also serving. That little webserver has a couple of functions.
- Configuration management (AP mode or Client mode, along with some other settings)
- JavaScript based Graph which updates every 1 second with Flow graphs
- Prometheus compatible /metrics page also updated every second.
This season I will probably just use the JavaScript based flow chart to make sure that all rows are flowing at about the same rate. But as you can see, I have a Prometheus support built in. Which means my longer-term goal is to have each datapoint logged into a time series database which can be used for post-processing a heatmap.
Interface demo
Here is a quick demo video of what the interface looks like on my phone.
Hardware Parts List
- Raspberry Pi Pico W
- Waveshare Pico-GPS-L76B
- Keystudio PICO IO Sheild
- SPI MicroSD Card Reader
- CR1220 Lithium Battery
- 1/4″ Flow Sensors
- 1/2″ Flow Sensors (optional, but I will use these for our 28 applicator)
- 3 Pin Waterproof Connectors
- Waterproof cable glands
- IP67 8.2″x4.2″x2.9″ Enclosure
Component Cost: $192.81
This assumes only 1 set of flow meters. I needed 1/4″ for our planter, but 1/2″ for our applicator.
Tools involved
Tools Cost: $42.56
Grand Total: $235.37
At less than $250 I call this a win, but really this project was probably less an $200 if i were to take out the cost of the crimp tool and all the extra leftover parts that I can use on other projects.
Not to mention that this flow meter should be able to be moved from one piece of equipment to another. This is important because corn gets two rounds of fertilizer applied to it, once when planted, and again when its about 6″ tall.
(Costs calculated at time of writing based on based prices available on Amazon. These are affiliate links, but it doesnt cost you anything, but helps me pay for more tech stuff to talk about)
Software
Before we wrap up part 1, let’s talk a litle more about the software.
The Raspberry Pi PICO can run programs written in several languages. Personally I prefer Python because it allows me to apply what I know from other programming projects and get going quickly.
For this project I use MicroPython because it has asynchronous IO and interrupts, Adafruit’s CircuitPython doesn’t. This was a critical design decision because of the flow meters. Remember I said that each row has its own flow meter? Well, keeping track of hall effect sensors that are pulsing very fast while also running a web server is nearly impossible without interrupts.
In addition to MicroPython I also have the following libraries in use:
- Microdot – for the webserver
- L76x – for the Waveshare GPS module
- MicropyGPS – also for the GPS module
- utemplate
Things that (already) didnt work
One thing to keep in mind when tinkering with small projects is cable length.
These little boards only run at 3.3v, and some protocols have limited signal distance, for example SPI. I bring this up because instead of a web page on my phone my original thought was to use a small 8×8 LED array and use 6 of the rows of LEDs to show the flow. This was just to be a quick “dashboard” style gauge for the tractor so you didnt need to keep your phone out.
But there was a problem. I needed to use about 20ft of cable to get from the controller, which would be on the planter, all the way up to the tractor. With 10 feet the LED’s worked fine, but as soon as I added the second 10ft section of wire … #fail.
So that idea had to be scraped, at least for now.
Comments
I would love to hear your feedback. You dont have to be a farmer, or know anything about agriculture, I would love to hear if you think I’m making a silly design choice, or if there is a better way to do something.
Let me know in the comments.
![]()


Pingback: DIY Precision Agriculture: Fertilizer Monitor with Raspberry Pi Pico Part 2 - Justin's IT Blog