This is the story of how I created a load generator using containers to performance test MS SQL and the effects on VSS stun time.
I’ve heard from customers more times than I can count that VSS is SUPER disruptive on their application. Some say it causes timeouts, some say users complain that things lock up, and some say that machines (like assembly line stuff) actually stop the work they’re doing because SQL stops responding to requests for a brief time.
But how long is brief?
Can you actually measure how long VSS takes to run?
I couldn’t find an easy way to track it. So I decided to go all #nerd and write some code to see how long VSS actually disrupts a SQL server.
For this project I basically had one goal – determine how long write queries are paused when VSS has SQL quiesced.
Scope Creep
This then morphed into a bunch more tests:
- SQL load testing and its effect on VSS pause time (original scope)
- SQL recoverability in the cloud using Zerto and ASR
– Is VSS really required to recover SQL? - Zerto Azure to Azure performance testing
- Azure Site Recovery Multi-VM replication testing
– Does replicating multiple VMs with ASR and VSS effect stun time?
On the ASR stuff – I’m not looking at it from a competitive angle, but more from the “does it work” and what are the pitfalls angle.
To be completely transparent, the Zerto ZCA used for in cloud protection doesn’t support VSS today. So I wanted to set some expectations as to what we might see when we do add support for VSS on the ZCA. Ie benchmark how long VSS stuns take on other platforms.
Testing Stack Architecture
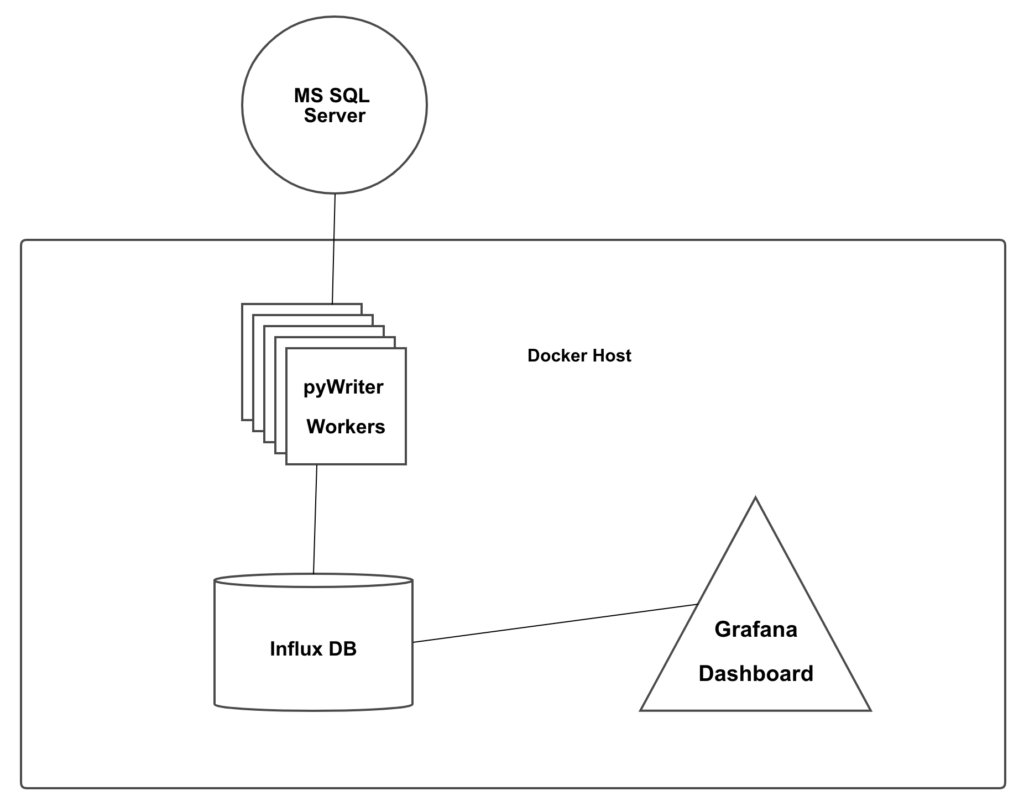
There are three components involved in this project. The first component is the load generator, pyWriter. The second component is InfluxDB, and the last component is Grafana.
PyWriter
Let’s face it, I’m about as creative with naming my projects as someone running a small block Chevy in a Camaro.
But don’t let the name fool you, there is plenty of cool factor under the hood!
pyWriter generates random data and sends write requests to SQL server. It logs how long it takes for SQL to acknowledge the write (down the the nanosecond) and then it sends that information to the InfluxDB service.
InfluxDB and Grafana
Once the response time data is saved in InfluxDB, Grafana can do it’s magic. Which is to create visualizations of data and allow you to see trends and anomalies. Especially when you scale up the number of data points.
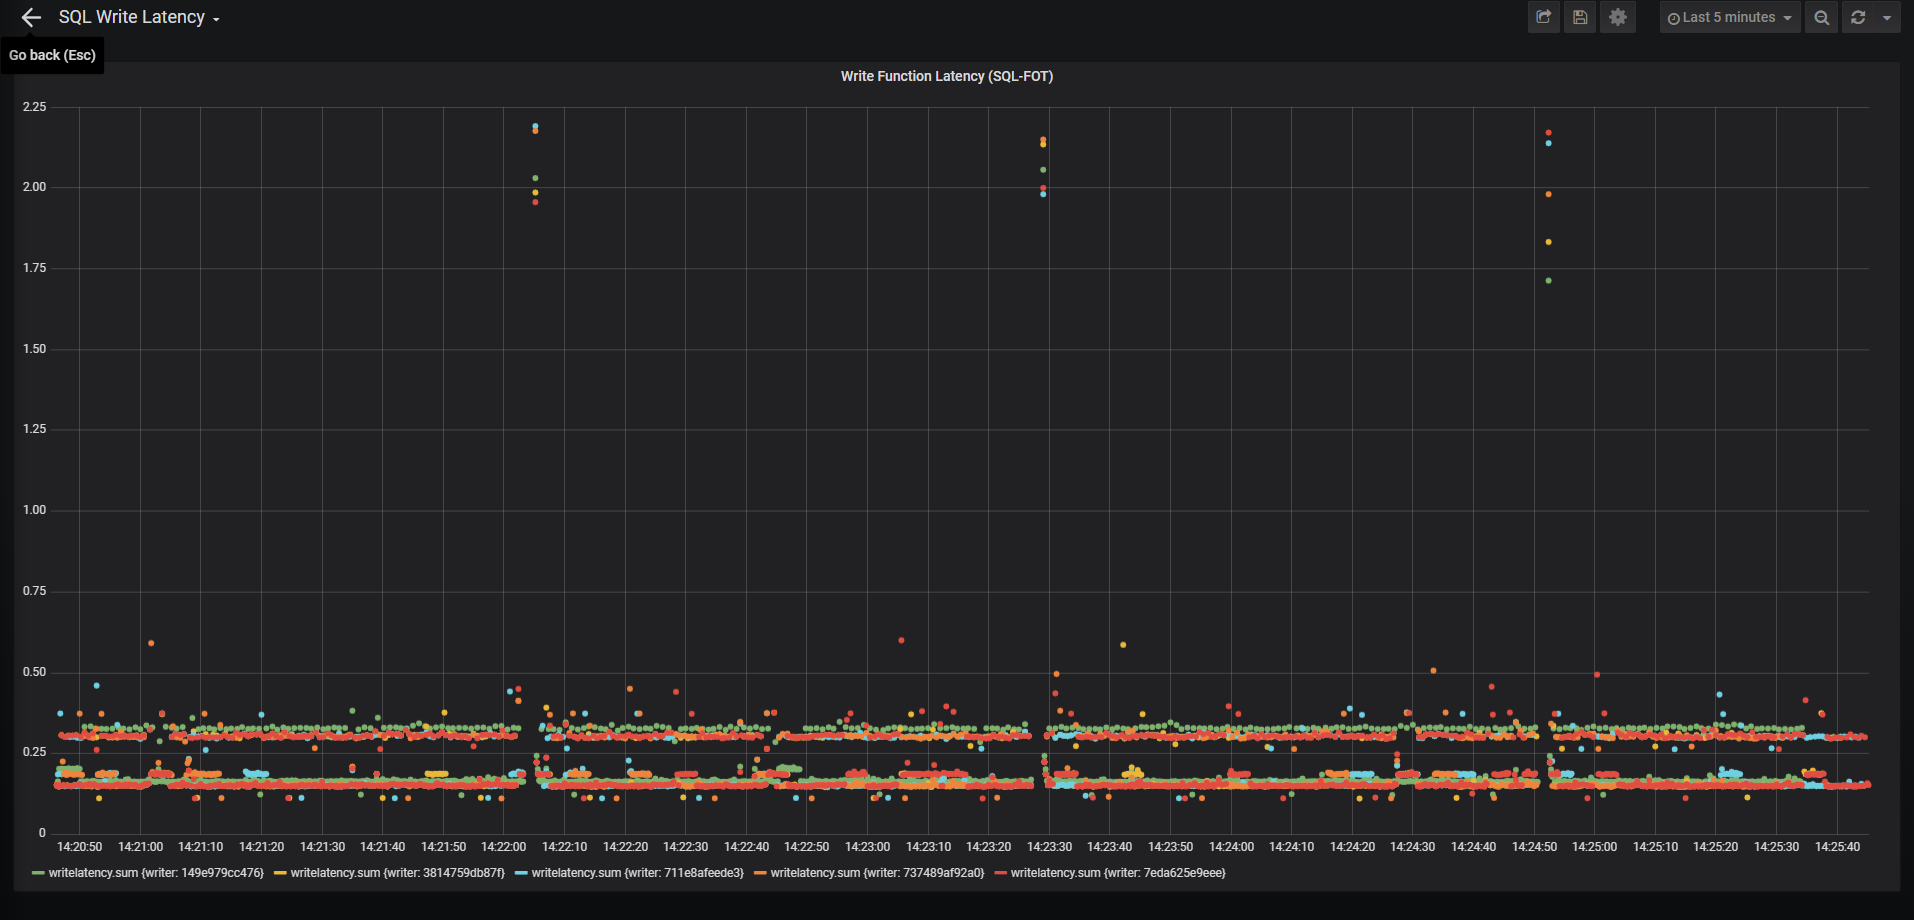
In the end here is what I’m looking at.
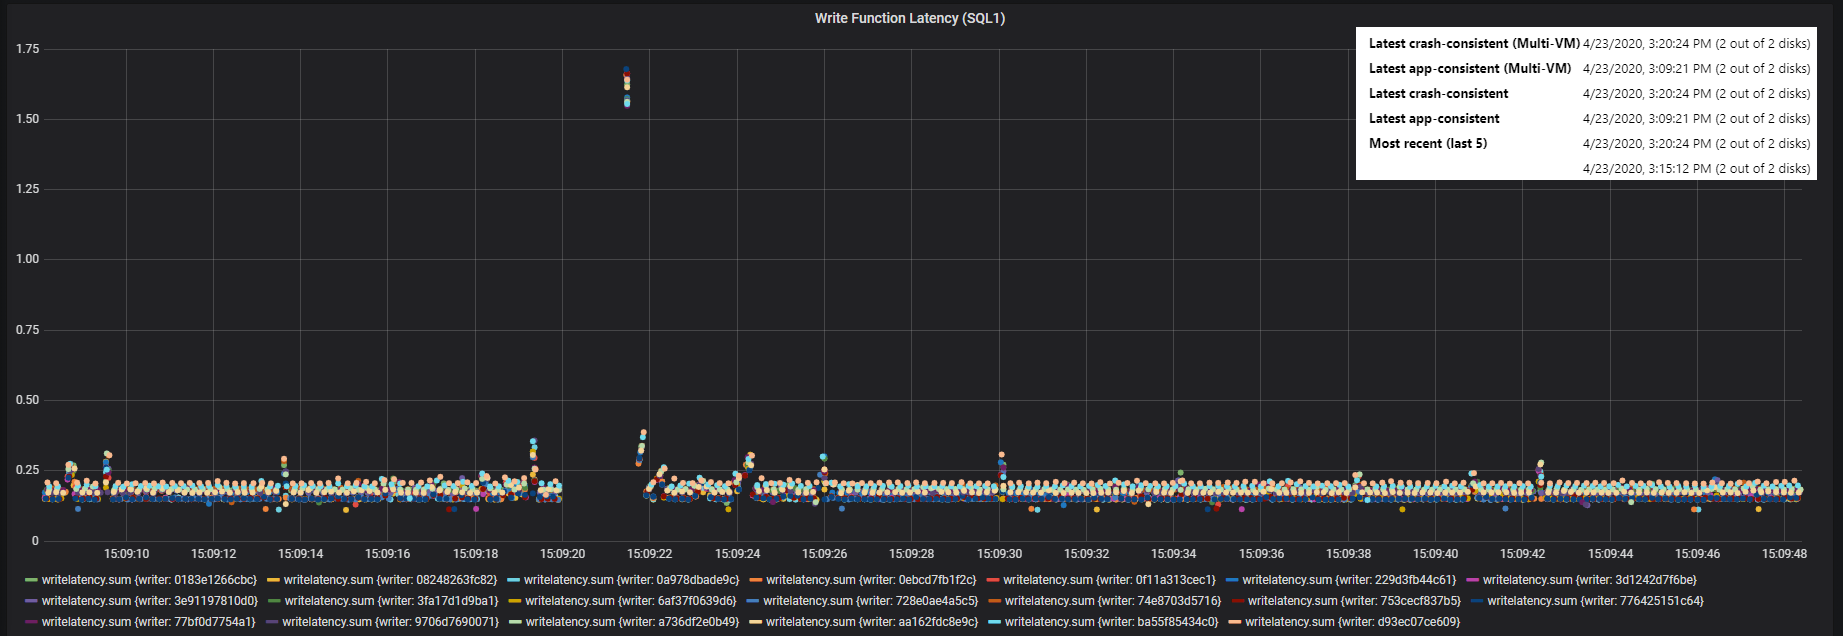
Each of the dots on the graph represents a SQL write query, with its completion time logged to the nanosecond.
Wasn’t this about VSS?
See the blank area in the graph above? It’s pretty easy to see from the graph that SQL has a pretty consistent response time. Except for one area. That blank spot, and the dots super high up are the effect of VSS. So now I can say that VSS has almost a 2 second effect on I/O.
To be precise the VSS snapshot is reported to have occurred at 3:09:21 PM. SQL did not respond to Write queries for almost 2 full seconds. Side note – this VSS query was done by ASR replicating 2 SQL VMs from West Central US to East US.
The code
There are two GitHub repos for this project. One contains the pywriter Python code, while the other contains the Docker Compose files that you will want to actually run it.
pyWriter Repo
The code in this repo does the actual work against SQL. Here is the basic workflow:
- Read an environment file for Server, Username, Password, number of times to loop each data set, and size of “junk” to add to each write
- Connect to an MS SQL server (to send write queries to)
- Connect to an Influx DB server (for reporting)
- Repeat the write and report steps until killed
This container is then wrapped inside of a docker-compose file along with a set of environment variable files and the other two containers that make up the stack.
The Stack Repo
The stack can all be found in this repo (pywriter-stack). If you want to try this at home, clone this repo!
Also… this script can bring SQL to its knees… don’t run this on a production machine, I take to liability if you break something or get fired!
To recreate this test you just need to clone that repo. Next edit the env.pywriter file with info on how to connect to your victim (ie DB server). On the SQL server you will need to manually create a database and execute the queries in the “setup.sql” file.
After that you’re ready to run the stack.
Running the stack
I won’t cover how to setup a linux machine to run docker containers or how to install docker-compose, as there are plenty of great posts on the web on how to do that.
Once you have that all installed though, simply run
docker-compose up -d
This will start InfluxDB, Grafana, and one pywriter worker.
Depending on the parameters in env.pywriter this can generate a very minimal amount of throughput all the way to a MASSIVE amount. With the default settings, 1 worker results in about .5 – 1 Mbps of throughput.
To increase the load you can scale the number of pywriter containers by typing:
docker-compose scale pywriter=XX
Where XX is a number between 0 and whatever your system can handle.
With 2 CPUs and 8GB of RAM I have scaled to as many as 120 containers. (My test machine was RAM bound at that point)
Setting up Grafana
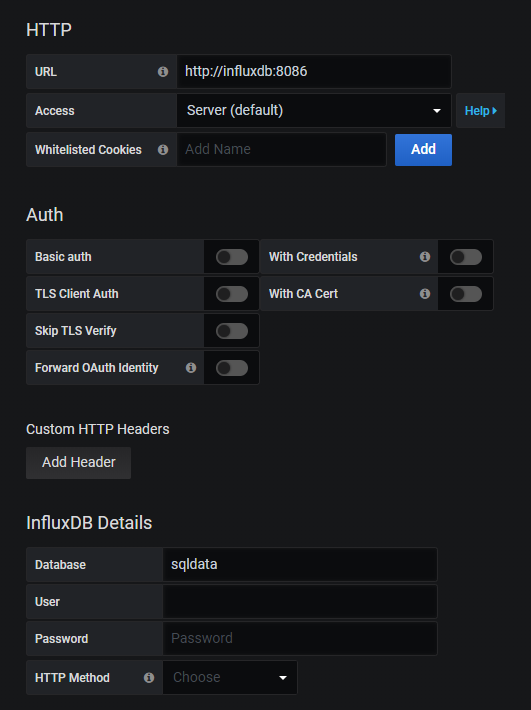
Once pyWriter is dumping stats into InfluxDB you can log in to Grafana and set up a data source and a dashboard.
Your datasource will be InfluxDB, and the host will be “http://influxdb:8086”, the Database will be “sqldata”. Once you set those two parameters hit Save & Test at the bottom.
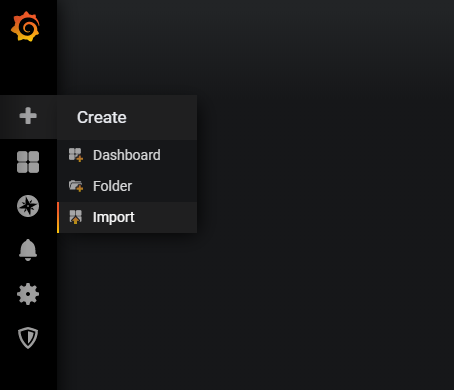
Next up import the dashboard.json file you downloaded with the stack repo. (simply open it in text edit or something and then paste it into Grafana.
Once you do that you can go to the new dashboard and see all of the dots. Each dot is one write query… logged to the nanosecond.
As you scale out your pywriter containers, they will automagically show up in the graph!
Some high-level results from these tests
After playing around for a week or so, here are some things I can tell you.
- Zerto 8.0 Cloud Appliances are 2x faster than their 7.5 counterparts
- Azure Site Recovery can cause 1-3 second pauses in your application when doing Application Consistent Checkpoints (this time goes up when you do multi-vm consistent checkpoints. I’ve seen pauses as long as 11 seconds!)
- You can load test Azure IaaS instances and disks with this tool to see how much of a write workload a particular disk can handle before becoming the bottleneck. (Use Resource Monitor and look for disk % active time)
- You can verify that even SUPER busy SQL servers (with full logging) will automatically recover when using Zerto
![]()